1995issue C041-17
Regime-aware stock screening with intermarket context
A historical case study ranked stocks by a short-horizon moving-average strength ratio and by relative earnings growth, then read the survivors against long-term rates, gold, and the utility average. That extra layer was intermarket context: a guide to the economic and inflation regime around the equity screen.
- Relative price strength compared Thursday's close with a Thursday-based 26-week moving average and ranked that ratio across a universe of about 8,000 stocks so the top 10 percent could be isolated.
- Relative earnings growth ranked the percentage change from the latest four-quarter reported earnings to the four-quarter total one quarter earlier, and high scores were described as showing a serial link to price action six months later.
- Intermarket context treated long-term rates, Treasury-bill futures with a forward line, gold, and the utility average as regime guides rather than as trading rules.
- The tested capital rule reserved capital for methods that had been checked and left untested cross-market and seasonal observations in the research layer.
The screen and the cycle
The historical workflow built a two-factor equity screen and then placed the surviving names in intermarket context. Relative price strength and relative earnings growth isolated the list. Long-term rates, Treasury-bill futures, gold, and the utility average were used as guides to the economic and inflation regime around that list.
High-ranked names were illustrated with charts that also listed liquidation stop prices. The archive presented the pairing of the two ranks as a simple, durable screen, and it treated the cross-market layer as context rather than as a separate trading rule.
Relative price strength
Empirical tests identified 131 trading days as the preferred lookback for relative price strength. That lookback was later implemented as a 26-week comparison.
Relative price strength was measured as the ratio of Thursday's close to the same Thursday-based 26-week moving average, then ranked across a universe of about 8,000 stocks so the top 10 percent could be isolated.
Comparing current price with its own moving average was described as more time-sensitive than longer comparison windows, because the ratio can fall quickly and give an earlier warning of a trend change.
Relative earnings growth
A second screen ranked stocks by the percentage change of latest four-quarter reported earnings versus the four-quarter total one quarter earlier. High scores showed a strong serial link to positive price action six months later.
Combining the relative-strength ratio with the relative-earnings-growth rank was presented as a simple, durable two-factor screen.
Alantec weekly price after the January 1995 screen
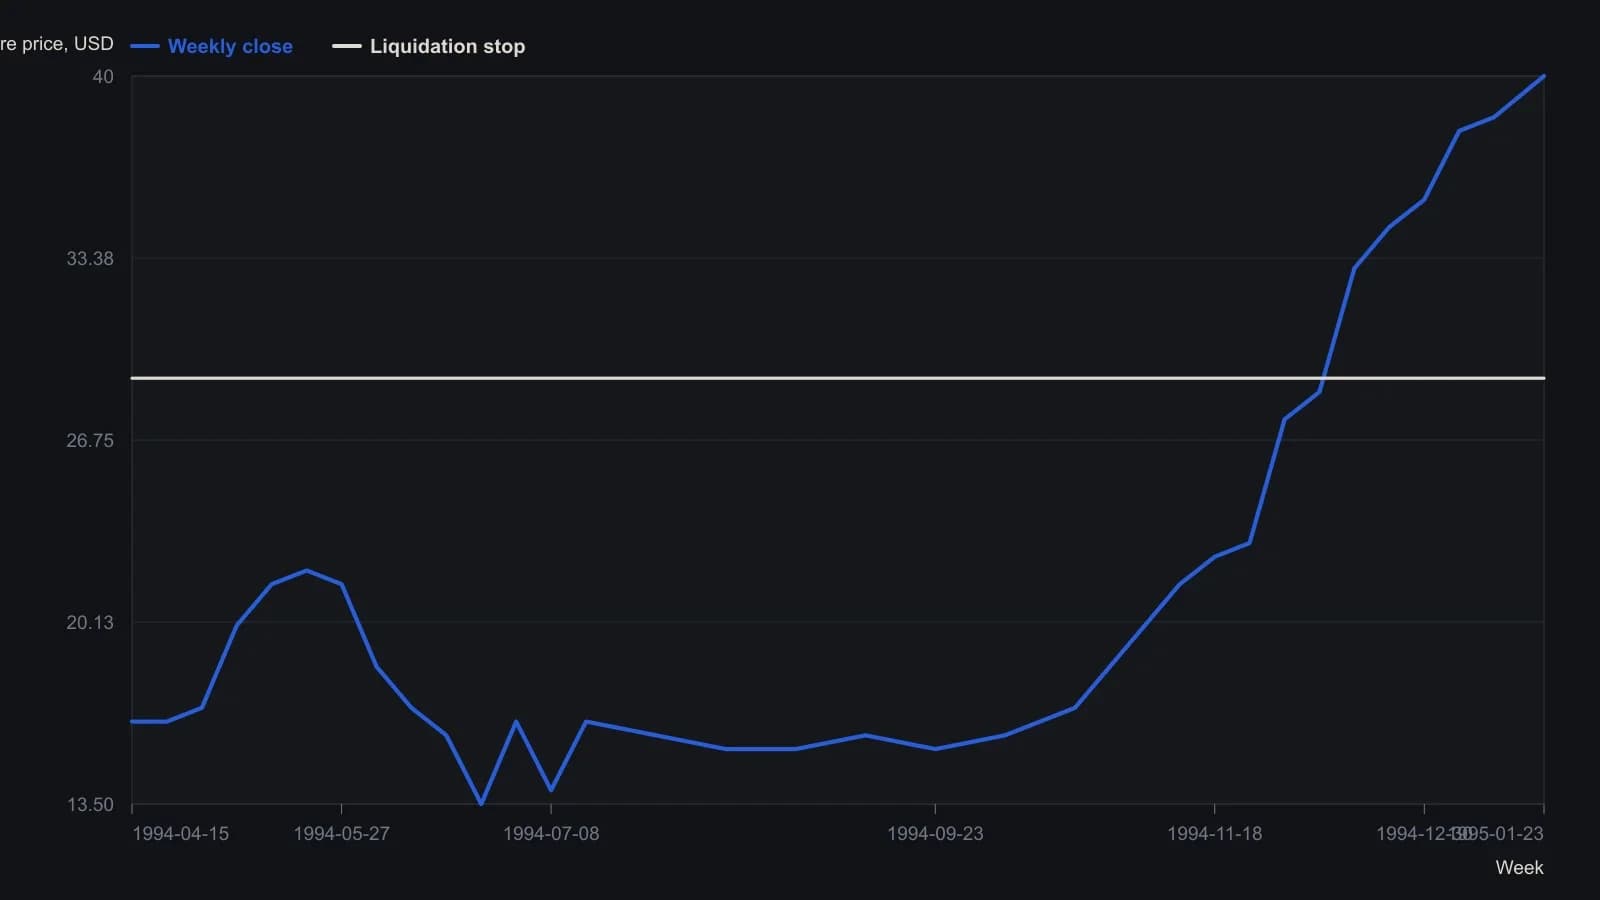
Weekly bars from the Technical Tools ChartBook print dated 23 January 1995. Closes before the final print are approximate to the nearest half-dollar on a five-dollar grid; the last close of 40.000 and the 29 stop come from the quote strip and the article, not from finer interpolation.
Volume after testing
Mechanical day-to-day stock volume was judged unusable after testing. A one-off anomaly such as a 200 percent volume surge with a sharp advance was still treated as worth watching.
Rates, gold, and the utility average
Long-term rates were treated as central to equity context on a business-cycle horizon. Technical study of unrevised economic series such as raw industrial prices, vendor performance, and jobless claims was used as a lead on economic strength and therefore on rates.
Treasury-bill futures were monitored with a forward line: a moving average of half the measured cycle length plotted half a cycle ahead. When the cycle was taken as 34 trading days, a 17-day average was placed eight or nine days forward. The forward line was a short-horizon projection that can flag a possible trend change when price overruns it.
Gold was watched as a clue to inflation attitudes that matter for rates. The utility average was treated as a frequent leader of the bond market. Both were used as regime guides rather than as trading rules.
The tested capital rule
Capital was risked only on methods that had been tested. Untested cross-market and seasonal observations stayed in the research layer. Mixing momentum one week with value the next was described as the usual path into trouble.
That practice is the tested capital rule: treat untested indicators as observation only and risk capital solely on methods that have been empirically checked.
All readings on this track · 21 readings
- 1986Two gates for setup and operator readiness
- 1990Time-only cycle dates in a Treasury bond case study
- 1990Constant-dollar regimes, the value line, and nested cycles
- 1992The four-year election cycle as an equity regime map
- 1992A semiconductor seasonal-index before the relative-strength overlay
- 1992Lock the holiday window as a regime, then veto resistance
- 1995Regime-aware stock screening with intermarket context
- 1996Standard-error bands, width gates, and weekday counts
- 1999Constructing seasonal factors from centered moving averages
- 2000Seasonal window, then weekly breadth
- 2004Copper as a regime map for cycles and recessions
- 2008Election-cycle windows as a mechanical seasonal system
- 2012A 2012 case study in Kondratieff-wave and presidential-cycle overlays
- 2012The October to May window as a mechanical portfolio procedure
- 2013Half-year seasonality as an equity regime overlay
- 2014Seasonal cycles as a regime overlay
- 2015Seasonal oil window as a defined-risk spread case
- 2017Calendar regimes, RSI events, and sector rotation rules
- 2018Seasonal windows as testable entry and abstention rules
- 2019Calendar rotation of seasonal and regime questions
- 2020Constructing calendar interval votes for cycle workbooks