1988issue C071-6
When volatility, not direction, selects the option spread
A directional long option that ignores volatility can lose if the market goes the other way, stays flat, or even moves as hoped, because time decay erodes premium. The archive workflow first places implied volatility in that contract's historical range, then matches an option spread to the volatility regime or abstains.
- A current volatility reading is high or low only when it is compared with that contract's own historical range.
- Very low volatility was associated with a high chance of a large subsequent move. Very high volatility was associated with a greater chance of a trading range.
- A directional long option that ignores volatility can lose if the market goes the other way, stays flat, or even moves as hoped, because time decay erodes premium.
- A volatility regime classifies a contract as low-and-rising, high-and-falling, or high-and-vertical and is used to select or abstain from an option spread.
A long option that ignores volatility
Volatility is computed from the option and the underlying futures market. It rises when that market moves rapidly and falls when it is quiet.
A directional long option that ignores that reading can lose if the market goes the other way, stays flat, or even moves as hoped, because time decay erodes premium. Direction alone does not decide whether buying options is timely.
High or low only against that contract's range
Implied volatility is the current option-implied magnitude of expected movement, judged against that contract's own historical range. Historical volatility is past realized movement used to mark whether today's implied reading is relatively high or low.
Comparing a current volatility reading with that contract's historical range is what identifies whether volatility is relatively high or low. A reading taken in isolation does not.
Place the regime before the strikes
The archive associated very low volatility with a high chance of a large subsequent move. It associated very high volatility with a greater chance of a trading range.
A professional workflow first places volatility in its historical range, then tests how different strikes and months behave under several market paths before deciding whether buying options is timely.
A volatility regime is a classification of a contract as low-and-rising, high-and-falling, or high-and-vertical, used to select or abstain from a spread. An option spread is a defined combination of strikes and months chosen to match that regime, including synthetic futures, neutral premium structures, and ratio spreads.
How volatility compressed in early 1987
In early 1987, grains and metals combined extremely low historical volatility with chart patterns that were read as raising the chance of an upside breakout.
In the same period, March S&P 500 out-of-the-money puts and calls bought in February lost value under high premium and short remaining life. Sellers of those options were favored regardless of direction.
Volatility can compress slowly or suddenly. Treasury bond volatility fell by almost 50% early in 1987. Swiss franc option volatility fell 30% in one day after an anticipated policy event produced no change, and puts and calls lost more than one-fourth of their value.
Swiss franc March 1987: 8-bar historical volatility
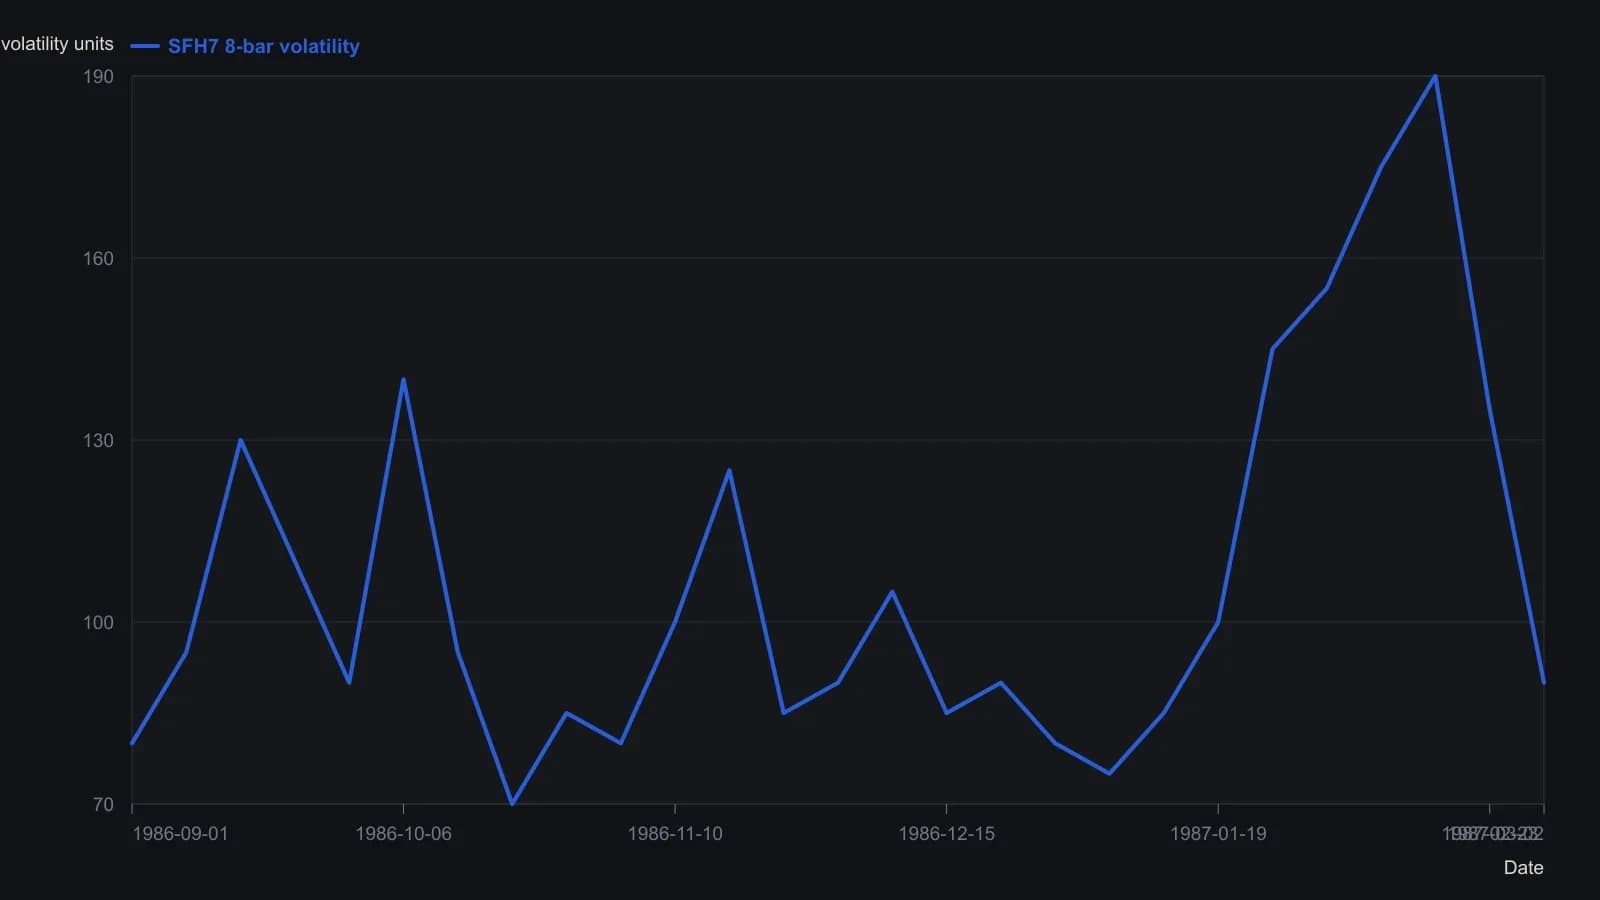
Points are approximate weekly readings from the Commodity Quote-Graphics lower pane labeled SFH7 DAILY 8 BAR VOLATILITY; the raster cannot support finer than about five volatility units. Printed session on 5 March 1987: open 6441, high 6498, low 6431, close 6482.
Three regime rules for the spread
Three regime rules map volatility to spreads.
Low and beginning to rise favors a six-month trend-line breakout, then a synthetic futures position. Synthetic futures are an option combination constructed to behave like a directional futures position after a low-volatility breakout.
High and beginning to decline favors a range and neutral premium positions.
High with a nearly vertical trend favors ratio spreads, because far-from-the-money options tend to be expensive versus closer strikes. A ratio spread sells more far-from-the-money options than it buys near-the-money options when the market trend is nearly vertical and outer strikes look expensive.
All readings on this track · 31 readings
- 1985Putting listed option premiums in volatility-regime context
- 1988When volatility, not direction, selects the option spread
- 1988Path-aware volatility for option-replication cost
- 1989Option premium inside a volatility regime
- 1990Constructing consistent historical and implied volatility
- 1991Weekly close-to-close volatility as a horizon filter
- 1995A modified volatility construction for weeks-to-months regimes
- 1996Option smiles as a critique of constant volatility
- 1996Pairing short and long historical volatility for regime context
- 1998Normalized multi-horizon historical volatility construction
- 2001Park one options idea inside an implied and historical volatility regime
- 2002Constructing vertical spreads inside seasonal volatility regimes
- 2002Volatility regime context for option straddles
- 2003Option spread construction with volatility regime checks
- 2003Trend and volatility filters for option spread choice
- 2005Constructing vertical spreads inside volatility regimes
- 2006Implied volatility doubling as a commodity regime signal
- 2007A butterfly reversal call when implied volatility sits near historical volatility
- 2012Evaluate a broken-wing butterfly inside a volatility and premium regime
- 2012Regime-aware equity construction via carry and risk premium
- 2012True range overlays versus isolated bar context
- 2012Constructing regime context for option premium trades
- 2013Construct a ranked volatility switch before the trend filter fires
- 2013Combining Relative Strength Index, historical volatility, and Bollinger %b screens
- 2014A headline equity high is incomplete until the nominal-real spread is read
- 2015Daily implied volatility skew as a portfolio benchmark
- 2015Rebuild a volatility-skew template from size and slope
- 2015Evaluating concentrated winners with volatility and option premiums
- 2017Option book construction from implied volatility, historical volatility and premium
- 2018One-year volatility as the backdrop for short-horizon option trades
- 2019A low-volatility ETF sleeve inside a 2011 to 2019 market-regime case study