1990issue C091-9
Constructing nested four-year market cycles
A two-scale construction locks a four-year dominant-step with valuation-extreme markers and a three-year-advance, one-year-reset shape, then nests those steps inside a longer envelope so historical analogs are compared by duration rather than slope.
- Rising and falling phases are built to overshoot a central value band rather than reverse at fair value.
- A valuation-extreme marks an approaching turn: average price-to-earnings above 20 with dividend yield near 3 percent for up-to-down, and dividend yield above 6 percent with price-to-earnings near 6 or 7 for down-to-up.
- The dominant-step lasts about 4.3 years in the rising half of a 33-year nested-envelope and about 3.9 years in the falling half, shaped as roughly three years of advance and about one year of reset.
- A duration-split, not a slope change, separates phases in the real-price-comparison: 3.55 years of advance and a 0.79-year correction on the way up, versus 2.37 years of advance and a 1.56-year correction on the way down.
Two scales of cycle construction
The construction sets a long-term market form so that rising and falling phases both overshoot a central value band rather than reversing at fair value. The shorter repeating advance-and-correction unit is the dominant-step. Successive dominant-steps are assembled into a nested-envelope.
Valuation-extreme markers
An approaching up-to-down phase change is marked when average price-to-earnings moves above 20 and average dividend yield falls near 3 percent.
A down-to-up phase change is marked when average dividend yield rises above 6 percent and average price-to-earnings settles near 6 or 7.
Shape of the dominant-step
The shorter rhythm used as the model building block measures about 4.3 years during the rising half of a 33-year envelope and about 3.9 years during the falling half.
That shorter rhythm is shaped as roughly three years of advance followed by about one year of decline that is treated as a stabilizing reset inside a positive-feedback market.
Participant-rotation at the peak
The construction assigns three participant roles, investors, traders, and novices, and locates the cycle peak at the point where all three groups are ready to switch from buying to selling. That sequenced entry and exit is participant-rotation.
Later four-year steps inside the rising envelope are described as carrying more novice participation and deeper required corrections until a correction matches or exceeds the prior advance and the envelope turns down.
Nesting steps in a longer envelope
One completed 33-year analog is bounded from 13 June 1949 to 12 August 1982. Nominal four-year step plots show the rising envelope clearly, while a real-price-comparison that uses an inflation-adjusted broad-index series is used to reveal the later declining envelope.
Duration-split in the real-price-comparison
In the real-price step model, rising and falling phases are separated mainly by duration. An up-phase advance lasts 3.55 years against a 0.79-year correction, while a down-phase advance shrinks to 2.37 years and the correction lengthens to 1.56 years. That duration-split attributes phase outcome to how long advances and corrections last rather than to a change in their slopes.
Holding-window check
A holding-period volatility plot is offered as mathematical support that most reduction in variability of a market average occurs inside the first four years, with only a small further gain when the window spans two such intervals. The holding-window is the multi-year span over which averaging a market series is said to enclose one complete shorter cycle.
Median four-year step lengths in the 1949–82 real-price model
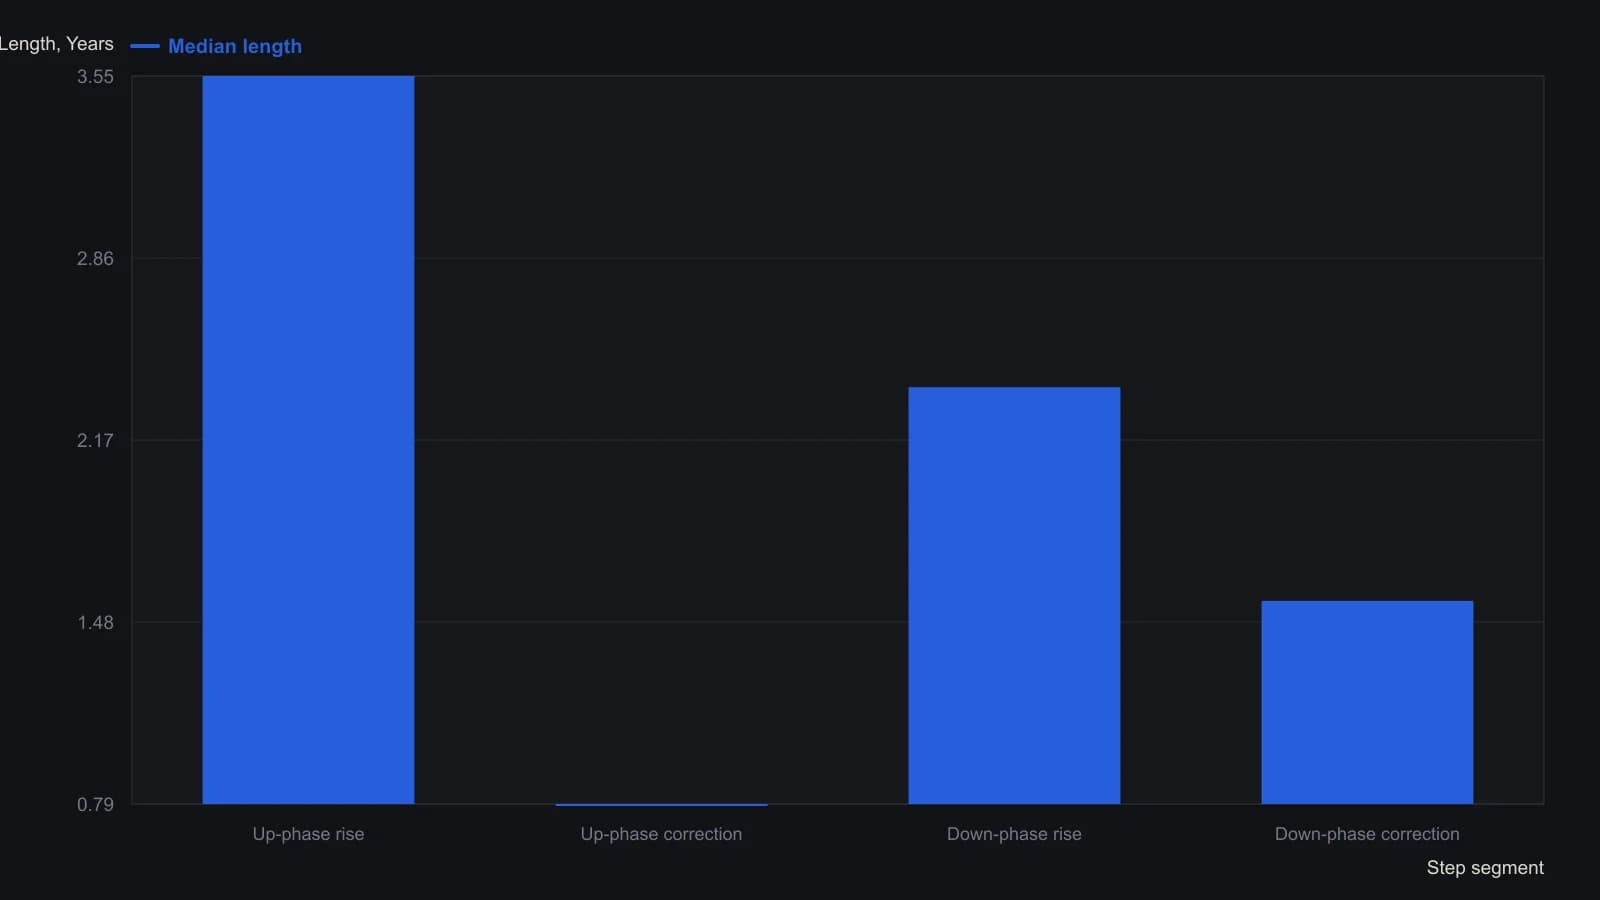
Medians of growth and time from that single 33-year cycle, stated in real dollars and without dividends. Arnold gives the matching annualized slopes as +18.15 percent and −28.64 percent in the up phase versus +15.01 percent and −28.39 percent in the down phase, so the regime difference is duration rather than slope.
All readings on this track · 19 readings
- 1988Crash fear fails the depression regime test
- 1990October 1987 cycle overlay and the loss-trap
- 1990Constructing nested four-year market cycles
- 1991Evaluating quarterly return runs with historical analogs
- 1992Evaluating split events across correction and bear regimes
- 1993Mining-bullion relative strength as a gold-sleeve regime
- 1994A two-horizon case study of a market-breadth oscillator
- 1994Extreme short-rate declines as equity regime context
- 1997Clustered true-range days as a regime label rather than a top forecast
- 2001Nearest-neighbor one-week forecast from log-price patterns
- 2001Constructing nearest-neighbor forecasts gated by a trend filter
- 2003Regime context for debt-era bear rallies
- 2004Testing a 1987 stock and gold analog by wave degree
- 2004Shifting calendar regimes and election-cycle analogs
- 2006Aligning sugar boom phases with seasonal analogs
- 2009Crowd consensus and failed targets as regime context
- 2011Treat a long-horizon chart analog as a regime scenario
- 2012Build a weekly analog as a dated forecast object
- 2015From a drawn price shape to an event-cloud case study