1994issue C121-11
A clocked stochastic second crest with a window-high stop
Teach one combination skill: read a 14-bar close slow stochastic as a classified second-crest pattern with a ten-bar-clock, then bind a window-high stop-loss so the reversal checklist is complete. Editorial interpretation: finish that checklist before a later divergence reading can appear.
- Read the 14-bar close slow stochastic as a named second-crest object with percent-k thresholds, not as an informal divergence glance.
- A valid short needs an established uptrend, a first crest that holds the 70-75 zone, and a return of percent-k that forms the second crest.
- The ten-bar-clock times the entry. Elastic-weakness-entry applies if bar 10 is the window high, and the stop-loss is otherwise the highest price in that window.
- Time-filtering can let a fully formed daily clock lead a weekly one. Treat a stall after entry as pattern-failure, and prefer an early exit if the sequence sits near an extreme.
A complete reversal checklist
This archive article teaches a combination skill. Read a 14-bar close slow stochastic with three-bar smoothing as a classified second-crest pattern with a fixed countdown, then bind that reading to a window-high stop-loss.
Editorial interpretation: finish this checklist before a later divergence reading can appear. The archive facts describe only the historical workflow below.
The stochastic-oscillator locates the latest close inside the prior 14-bar high-low range rather than against the price 14 bars earlier. Pattern-recognition treats selected oscillator shapes as named sequences with thresholds, a second crest, and a timed completion rule rather than as informal divergence glances.
The oscillator and percent-k
The only oscillator form used is that 14-bar close slow stochastic with three-bar smoothing. Percent-k is the fastest stochastic line. It is the line used to test the upper-zone hold, the limited pullback, and the return that creates a second crest.
The method treats selected oscillator shapes as pattern-recognition objects. Price action is said to imprint momentum, so those shapes can be classified by form, frequency, and a defined forecast role.
Uptrend context and the two crests
A valid setup requires an established uptrend defined by both a trendline and a 40-period moving average. The intended short runs against that upswing.
The first crest requires percent-k to hold above the 70-75 zone for at least three bars, then ease to or below 75 without falling through 55. After a reading of 85 or higher, the same crest may instead ease only 10 to 15 points from that extreme.
The second-crest look requires percent-k to climb back into the 70-75 zone within five bars. After an extreme peak, the return may instead retrace at least 50 percent of the first decline.
The ten-bar-clock and the entry
The ten-bar-clock starts on the nearest price bar that first pulled percent-k down from the opening crest. A short is taken on the close of bar 10.
Elastic-weakness-entry applies when bar 10 is the window high. In that case entry waits for the first lower open or lower close inside the next three bars.
The window-high stop-loss
Unless bar 10 is itself the high, the stop-loss is the highest price printed during that 10-bar window.
When the sequence stalls near an extreme, the described risk rule prefers exiting before a new high rather than leaving the stop-loss at those highs. A break through the old high can produce large stop slippage.
Time-filtering across intervals
Time-filtering means checking the same oscillator sequence on more than one sampling interval so a shorter clock can lead a longer one.
Weekly instances are treated as usually dominant because they span more time and larger swings, but a fully formed daily instance can lead. A daily cocoa example completed five days before the weekly counterpart.
Pattern-failure after the timed entry
If resolution is not prompt after entry, at worst within 10 periods, the setup is treated as failed.
Pattern-failure is a stall after the timed entry in which the oscillator crosses back up, or price only ranges and is slow to break trend, average, or RSI support. Typical failure signs are an oscillator upswing crossover after the turn, or range-bound trade that is slow to impair trendline, moving-average, or RSI support.
Daily Value Line: second stochastic crest and 10-bar short
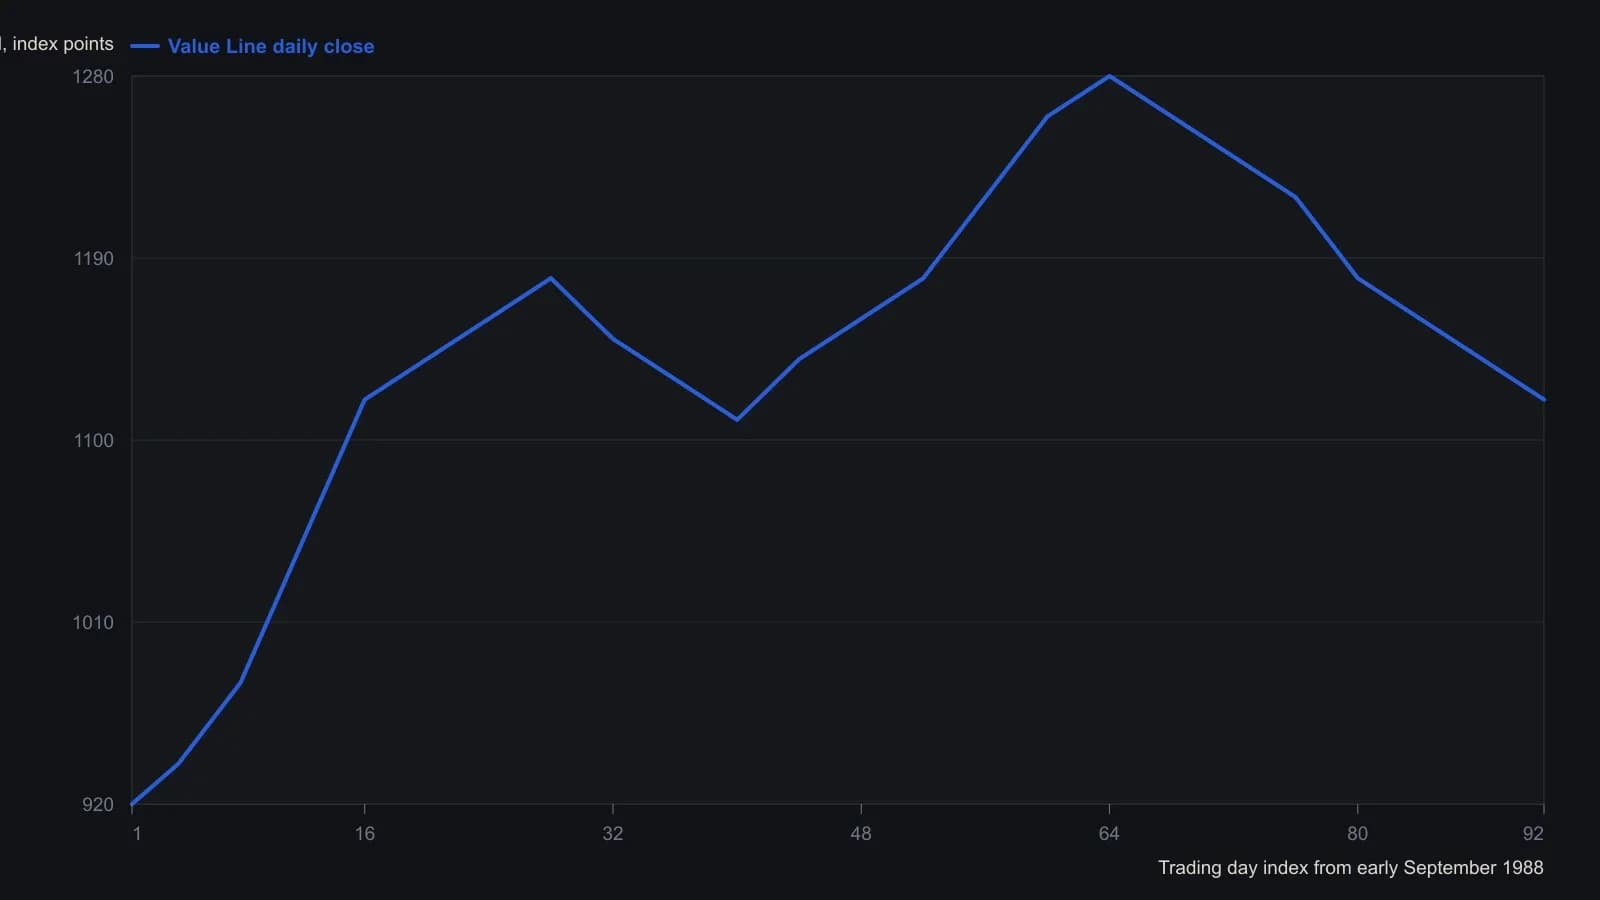
Raster digitization of daily OHLC and the 14-bar close slow stochastic with three-bar smoothing. Price axis is inverted (higher values lower on the pane). Approximate closes only; no more than 60 points.
All readings on this track · 25 readings
- 1986Construct a decision procedure that revises itself
- 1989Finish the volume checklist before scoring the breakout
- 1989Constructing supervised forecasts on moving averages
- 1991Candlestick labels as stacked construction tests
- 1992Walk-forward evaluation of weekly price-change patterns
- 1993RSI price pattern templates and open interest
- 1994Constructing a dual-net day-ahead index direction forecast
- 1994A clocked stochastic second crest with a window-high stop
- 1996Volatility-ratio, inside-day and narrow-range-4 entry construction
- 1998Sliding-window correlation for cup-and-handle construction
- 2000Constructing rectangles for breakout hypotheses
- 2001Turning one candle into a ranked numeric object
- 2002Fuzzy-scored chart patterns as testable rules
- 2002From hot-zones to an open-close-matrix
- 2003Volume pressure and a band-clearing breakout case
- 2004Evaluating chart patterns against price objectives
- 2004Cobweb turning points from price structure
- 2005Hybrid decision trees and pattern recognition for trend rules
- 2005Two-bar zone codes for testable pattern systems
- 2005Price bar pattern construction and next-bar frequency
- 2008Observe markets before following pattern or system rules
- 2012Treat a four-leg Fibonacci completion as an unpaid hypothesis
- 2014Hidden three-channel regression signals for stock and call option entries
- 2014A shared daily-chart-level framework for session trades and swing holds
- 2015Condensed candlestick signatures