2011issue C0110-15
Treat a large one-day move as a classified event
A large daily move is easier to evaluate once it is sorted into a signed magnitude bucket. The next few sessions then become separate checkpoints in a short procedure, not a story about momentum.
- Price-change categorization sorts each session into a signed magnitude bucket so later sessions can be compared as like-with-like outcomes.
- The next-session window treats the first, second, and third sessions after the classified day as separate checkpoints rather than one blended result.
- A contrarian strategy takes the opposite side of an extreme daily move only when the same rule set also says when to stand aside.
- State the sample environment before treating any bucket result as a general rule.
Sort the day before narrating momentum
A large one-day move is often told as a momentum story. The archive workflow treats it as a classified event instead.
Price-change categorization sorts each session into a signed magnitude bucket so later sessions can be compared as like-with-like outcomes. The study applies that step to daily SPY percentage changes, using six signed magnitude buckets, so later sessions can be compared within the same category.
Judge a short next-session window
After the day is classified, the next-session window is the first, second, and third sessions after that classified day. Those sessions are treated as separate checkpoints rather than one blended result.
That three-day follow-through is treated as only part of a system. Volume-conditioned results are left for a later study.
Mean reversion is a working assumption
Mean reversion is a working assumption that an outsized daily move is more likely to be followed by a pullback or fade than by an equally large continuation.
A contrarian strategy is the rule set that takes the opposite side of an extreme daily move and specifies when to stand aside. Entry, exit, and the choice to stand aside stay inside one procedure.
What the buckets showed in that window
After days at or above a 2 percent advance, the next session showed an average loss of 49 cents, with 13 advances versus 18 declines across 31 such days.
Within matching magnitude brackets, down days showed higher average volume than up days.
A fade after an extreme up day is presented as a percentage play, not a sure thing. One repeat strong up day and three consecutive losing days still appeared in the extreme buckets.
Average SPY change over the next three sessions by prior-day bucket
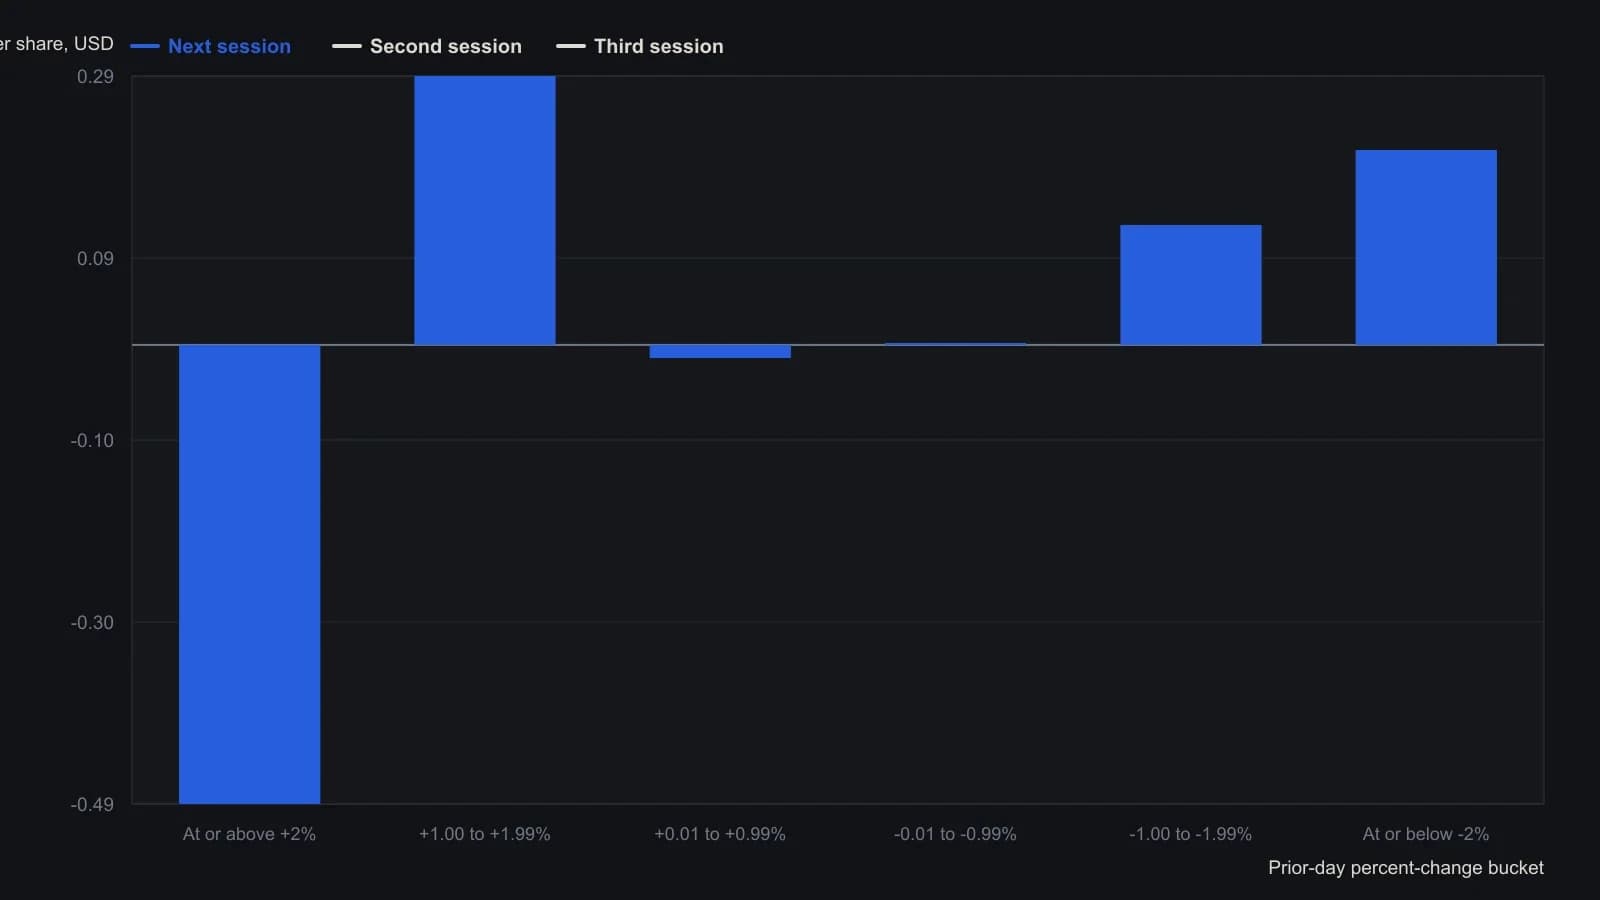
The window is a rising market that opened at $90.44, bottomed at $67.10, peaked at $121.81, and closed at $103.22. Bucket sizes are 31, 49, 129, 90, 44, and 33 days. The author warns a bear market can invalidate the pattern.
Editorial reading
This paragraph is a TradersWeek editorial reading and is not an archive claim. The useful habit is to classify the daily move first, then judge the next few sessions as a short, testable procedure instead of a story about momentum.
All readings on this track · 36 readings
- 1986A futures fade as one range, order, and secrecy procedure
- 1992Constructing the mass-index range-reversal procedure
- 1993Switch trend following and mean reversion with an equity-curve filter
- 1994Evaluating weekly trend-following and mean-reversion timing rules
- 1996Dual-horizon bands for a precious-metals cash switch
- 1997Constructing a moving regression oscillator
- 1997Regime-dependent long and short rules in mechanical systems
- 2002A same-session pair book with a morning-fixed volatility envelope
- 2004Combining noncorrelated trend and reversion systems
- 2004Failed-breakout overlays on trending markets
- 2004Rank rotation after a path split, then Robustness testing
- 2004Range-bound tape as a filter for trend and oscillator rules
- 2005A moving-average short pullback that is only in scope in a decline
- 2006Constructing an adaptive price zone from a double-smoothed range
- 2007Two-period relative strength index versus a one-week universe baseline
- 2008Building ETF mean-reversion entries with a two-bar washout
- 2008Rebuild a short-period stochastic as a premier stochastic oscillator
- 2008A three-market regime map for equity bounces and dollar cycles
- 2009Option trade adjustment as one testable procedure
- 2010Implied volatility as a May 2010 market-regime lab for the S&P 500
- 2011Treat a large one-day move as a classified event
- 2011Long-call exits, volatility regimes, and spread assignment
- 2011Pairing same-horizon oscillators with a walk filter
- 2012Two-bar band extreme entries with trailing stops
- 2012An eight-month average as a monthly gate for high-yield bonds
- 2014Complete the checklist before the trade
- 2014Coded rules should face one test, not a kinder sample
- 2015Build a mean-reversion basket from one correlation path
- 2015Index dip reversion is horizon and regime dependent
- 2016Treat the end of a trend as a handoff, not a broken system
- 2017A testable half-swing pullback for trend continuation
- 2017Evaluating four swing detection rules for mean reversion
- 2018Intraday breakout and mean reversion as one rule set
- 2018Evaluating rare consecutive-close mean-reversion entries
- 2020Moving-average baselines, price vetoes, and mean reversion
- 2020Two-dimensional FX scaling for trend and reversal systems