2011issue C1211-18
Pairing same-horizon oscillators with a walk filter
Place a relative-strength index and a stochastic oscillator on one shared horizon, then add a walk-normalized displacement filter, to see when extra oscillators repeat the same extremes and when agreed readings become one mean-reversion procedure for entry, exit, or abstention.
- Most technical readings depended on changing cyclic content, so a method aligned with the current cycle produced timely marks and a misaligned method produced out-of-phase marks.
- When a stochastic oscillator, band-position, walk index, channel index, and percent-R shared one timeframe, they marked the same overbought and oversold areas.
- Standalone walk permutations were not judged a robust system. The useful output was overbought and oversold information placed beside a standard oscillator.
- Agreement of the walk and band-position on an overbought or oversold state was treated as a clear mean-reversion condition. When the studies diverged, walk slope set probable direction and pullbacks were preferred to fading a rising walk trendline.
A shared horizon first
Most technical readings in the study depended on changing cyclic content. A method aligned with the current cycle produced timely marks. A method that was not aligned produced out-of-phase marks.
Editorial reading: compare the two oscillators only after they share one sampling interval and lookback. The relative-strength index is a bounded momentum reading from ordered closes over a fixed lookback, used as a same-horizon overbought and oversold forecast. The stochastic oscillator is a range-position oscillator from recent highs and lows over a defined sampling interval, used as the baseline overbought and oversold forecast.
Walk as a companion filter
The walk construction compared an up series and a down series with a random-walk baseline. A reading above 1 on either series was treated as a trend in that direction. That pair is the random-walk-index: up and down displacement series scaled by path length and average true range so each reading can be compared with a random-walk baseline and with other price series.
The up-walk and the down-walk are the two sides of that index. The walk denominator used path length and average true range so gold, currency, and equity series could be compared on one scale.
Standalone permutations of the walk were not judged a robust system. The useful output was overbought and oversold information placed beside a standard oscillator.
When extra oscillators repeat the same area
When a stochastic oscillator, band-position, walk index, channel index, and percent-R were set to the same timeframe, they marked the same overbought and oversold areas. Band-position here is percent-b: the close located between an upper and a lower statistical band, used as a second overbought and oversold scale.
Editorial reading: on one shared horizon, a relative-strength index that only restates those same extremes is redundant. The pair is then a repeated forecast, not new information.
Lookback-information at two horizons
Lookback-information is the extra or missing turning-point content that appears when the same method is recomputed at a short horizon and a long horizon. At an 80-bar lookback the walk lost some turning-point content but gained four items, while band-position lost content and gained none. Both still carried trend-direction information.
Same-period walk and band-position were described as nearly identical for trend identification. The extra walk content looked closer to cycle-free in the 20-bar versus 80-bar comparison.
From agreed extremes to one procedure
Mean-reversion is a testable rule set that treats clustered overbought or oversold states as conditions for fade, exit, or abstention rather than as a standalone trend engine. Agreement of the walk and band-position on an overbought or oversold state was treated as a clear mean-reversion condition. Many strong moves in the examples began from those readings.
When the two studies diverged, walk slope was used for probable direction. Fading a rising walk trendline was treated as a weaker tactic than using pullbacks to enter or add.
An hourly diary combined walk-band extremes, a stochastic-style oscillator panel, and price structure into one entry, exit, and skip procedure. The diary included cases where only the walk was oversold.
September 2011 Chicago wheat, daily
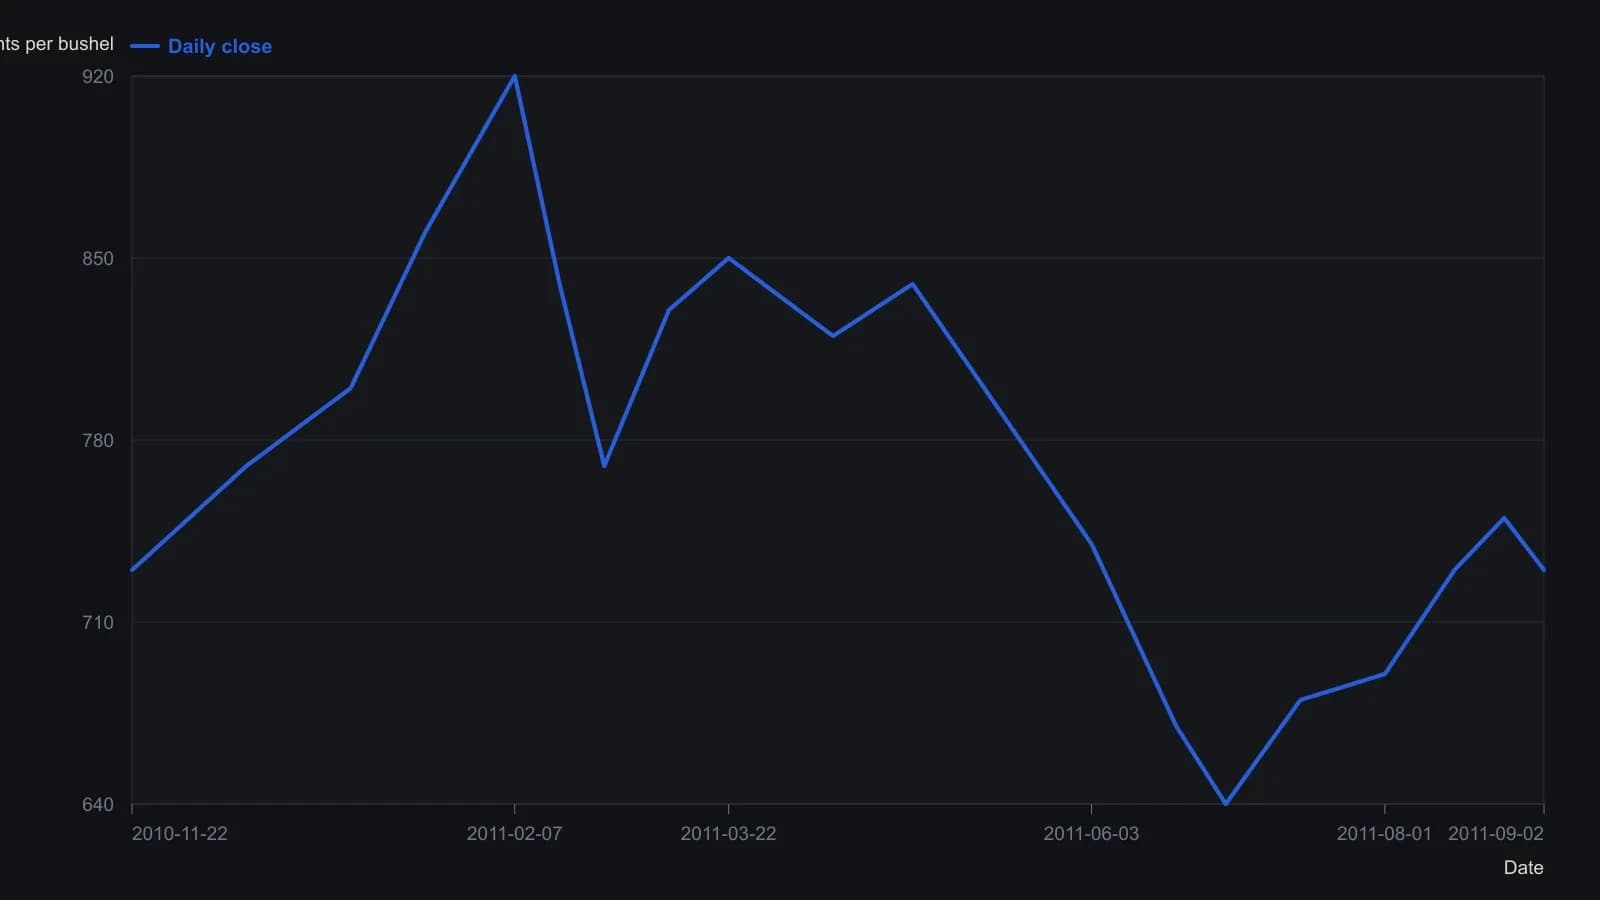
Last printed price on the NinjaTrader scale is 730 cents; other closes are digitized to the nearest ten cents. Oscillator panes were not rebuilt because each study uses a different unit from price.
All readings on this track · 36 readings
- 1986A futures fade as one range, order, and secrecy procedure
- 1992Constructing the mass-index range-reversal procedure
- 1993Switch trend following and mean reversion with an equity-curve filter
- 1994Evaluating weekly trend-following and mean-reversion timing rules
- 1996Dual-horizon bands for a precious-metals cash switch
- 1997Constructing a moving regression oscillator
- 1997Regime-dependent long and short rules in mechanical systems
- 2002A same-session pair book with a morning-fixed volatility envelope
- 2004Combining noncorrelated trend and reversion systems
- 2004Failed-breakout overlays on trending markets
- 2004Rank rotation after a path split, then Robustness testing
- 2004Range-bound tape as a filter for trend and oscillator rules
- 2005A moving-average short pullback that is only in scope in a decline
- 2006Constructing an adaptive price zone from a double-smoothed range
- 2007Two-period relative strength index versus a one-week universe baseline
- 2008Building ETF mean-reversion entries with a two-bar washout
- 2008Rebuild a short-period stochastic as a premier stochastic oscillator
- 2008A three-market regime map for equity bounces and dollar cycles
- 2009Option trade adjustment as one testable procedure
- 2010Implied volatility as a May 2010 market-regime lab for the S&P 500
- 2011Treat a large one-day move as a classified event
- 2011Long-call exits, volatility regimes, and spread assignment
- 2011Pairing same-horizon oscillators with a walk filter
- 2012Two-bar band extreme entries with trailing stops
- 2012An eight-month average as a monthly gate for high-yield bonds
- 2014Complete the checklist before the trade
- 2014Coded rules should face one test, not a kinder sample
- 2015Build a mean-reversion basket from one correlation path
- 2015Index dip reversion is horizon and regime dependent
- 2016Treat the end of a trend as a handoff, not a broken system
- 2017A testable half-swing pullback for trend continuation
- 2017Evaluating four swing detection rules for mean reversion
- 2018Intraday breakout and mean reversion as one rule set
- 2018Evaluating rare consecutive-close mean-reversion entries
- 2020Moving-average baselines, price vetoes, and mean reversion
- 2020Two-dimensional FX scaling for trend and reversal systems