2007issue C111-3
Two-period relative strength index versus a one-week universe baseline
Editorial view: lock a liquidity-filtered universe and a one-week hold before treating oscillator length as settled. A January 1, 1995 through December 31, 2006 sample then asked whether two-period relative strength index extremes sat on a different next-week distribution than the 0.25 percent universe baseline.
- Editorial stance: treat the oscillator lookback as a hypothesis after the liquidity screen and one-week hold are locked, not as a default setting.
- The historical sample kept names priced above 5 dollars with a 100-day average volume above 250,000 shares and used the 0.25 percent one-week average change of all qualifying names as the comparison baseline.
- Names with a two-period reading below 2 had a one-week average change of 0.88 percent, while names above 98 had a one-week average change of -0.17 percent. The fourteen-period setting did not show a distinguishable next-week advantage.
- A 200-day moving-average trend filter, consecutive days below 2, and an intraday decline of 1 to 3 percent were proposed only after that short-horizon comparison.
Treat the lookback as a hypothesis
This archive article takes an editorial position. A popular oscillator lookback is a hypothesis, not a default. The useful order is to lock a liquidity-filtered universe and a one-week holding window first, then ask whether a two-period extreme sits on a different next-week distribution than the universe average. A long-horizon trend filter is layered on only after that comparison is specified.
The relative strength index is a bounded oscillator that compares recent up-close magnitude with recent down-close magnitude over a chosen lookback so that short-horizon extremes can be compared with a longer default setting. Mean reversion, in this procedure, treats two-period oscillator readings below 2 as oversold candidates and readings above 98 as overbought names to avoid or fade, then exits after five trading days.
The filtered universe and the one-week baseline
The historical sample ran from January 1, 1995 through December 31, 2006. It kept only names priced above 5 dollars with a 100-day average volume above 250,000 shares. More than eight million trades were reviewed.
The one-week baseline is the average five-session percentage change of every name that clears that price and volume screen. In the filtered universe the one-week average change was 0.25 percent. Editorial note: that figure is the explicit comparison for oscillator-selected groups in this sample, not a claim about later markets.
Two-period extremes versus the fourteen-period default
A two-period extreme is a two-period relative strength index close below 2 or above 98. Oversold was defined as a two-period relative strength index below 2, and overbought as a reading above 98.
Names with a two-period reading below 2 had a one-week average change of 0.88 percent in that sample, while names above 98 had a one-week average change of -0.17 percent. The same historical sample compared the two-period relative strength index with the common fourteen-period setting and reported that the longer default did not show a distinguishable next-week advantage.
Two-period RSI extremes versus the one-week universe baseline
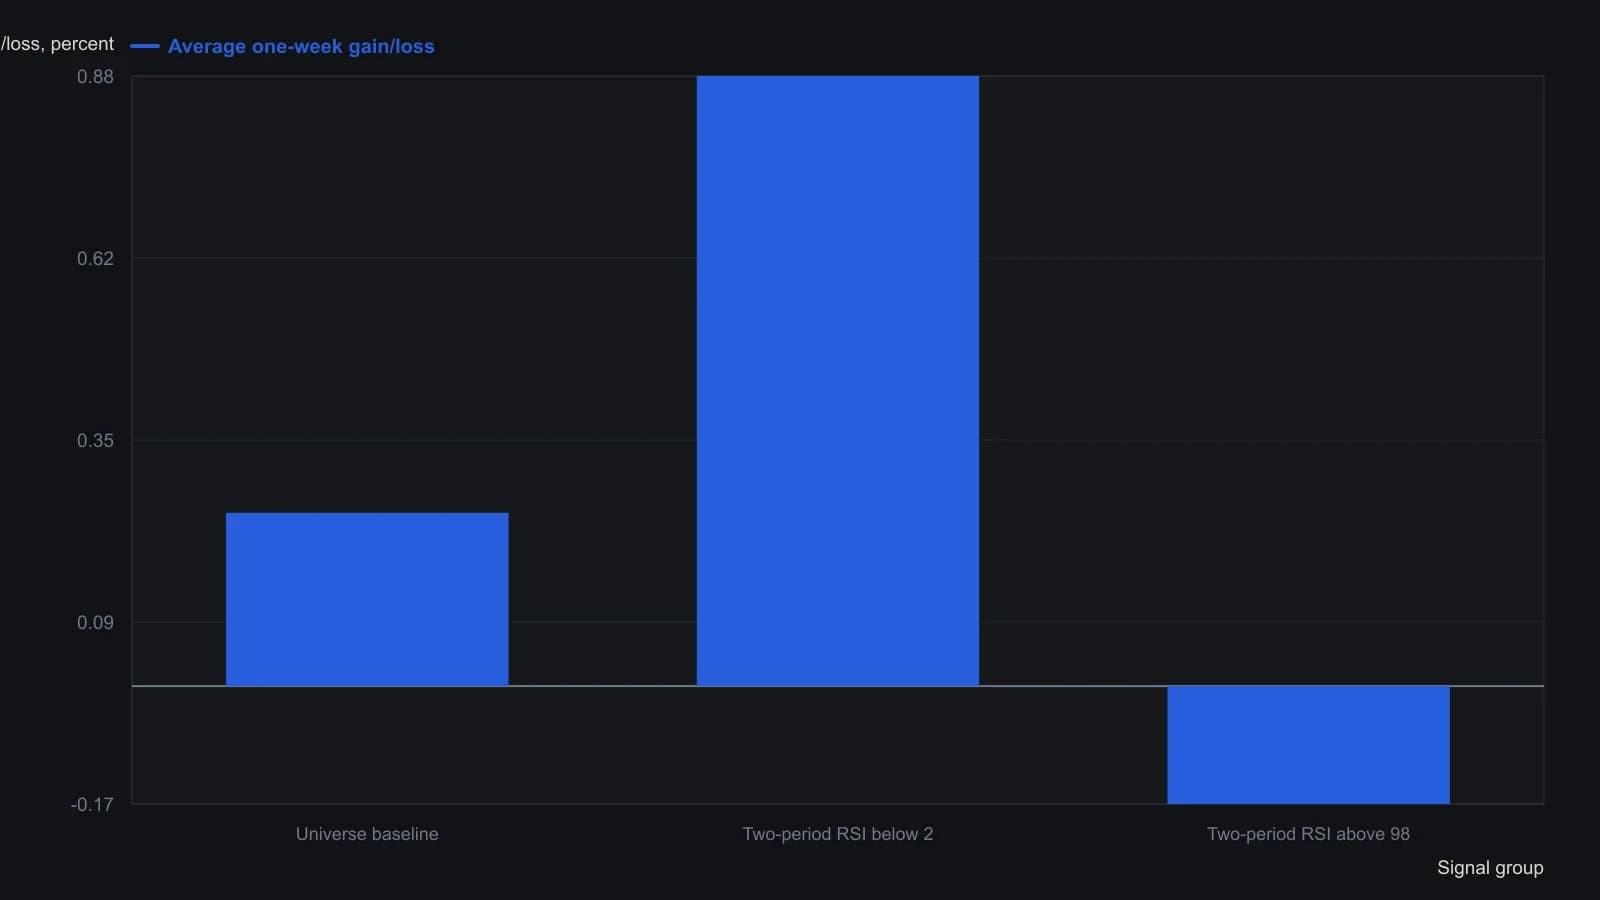
Universe filter: price above $5 and 100-day average volume above 250,000 shares; more than eight million trades. Hold is five trading days. The 14-period RSI is described as having little or no edge, but no 14-period return is reported.
A trend filter comes after the oscillator comparison
A trend filter is a long-horizon moving-average screen, here a 200-day average, used only after the short-horizon oscillator comparison is specified, to keep mean-reversion tests inside a broader directional regime. Editorial reading: that order keeps the first question intact, namely whether the two-period extreme differs from the one-week baseline.
A 200-day moving-average trend filter, consecutive days below 2, and an intraday decline of 1 to 3 percent were proposed as further tests around the same short-horizon oscillator.
All readings on this track · 36 readings
- 1986A futures fade as one range, order, and secrecy procedure
- 1992Constructing the mass-index range-reversal procedure
- 1993Switch trend following and mean reversion with an equity-curve filter
- 1994Evaluating weekly trend-following and mean-reversion timing rules
- 1996Dual-horizon bands for a precious-metals cash switch
- 1997Constructing a moving regression oscillator
- 1997Regime-dependent long and short rules in mechanical systems
- 2002A same-session pair book with a morning-fixed volatility envelope
- 2004Combining noncorrelated trend and reversion systems
- 2004Failed-breakout overlays on trending markets
- 2004Rank rotation after a path split, then Robustness testing
- 2004Range-bound tape as a filter for trend and oscillator rules
- 2005A moving-average short pullback that is only in scope in a decline
- 2006Constructing an adaptive price zone from a double-smoothed range
- 2007Two-period relative strength index versus a one-week universe baseline
- 2008Building ETF mean-reversion entries with a two-bar washout
- 2008Rebuild a short-period stochastic as a premier stochastic oscillator
- 2008A three-market regime map for equity bounces and dollar cycles
- 2009Option trade adjustment as one testable procedure
- 2010Implied volatility as a May 2010 market-regime lab for the S&P 500
- 2011Treat a large one-day move as a classified event
- 2011Long-call exits, volatility regimes, and spread assignment
- 2011Pairing same-horizon oscillators with a walk filter
- 2012Two-bar band extreme entries with trailing stops
- 2012An eight-month average as a monthly gate for high-yield bonds
- 2014Complete the checklist before the trade
- 2014Coded rules should face one test, not a kinder sample
- 2015Build a mean-reversion basket from one correlation path
- 2015Index dip reversion is horizon and regime dependent
- 2016Treat the end of a trend as a handoff, not a broken system
- 2017A testable half-swing pullback for trend continuation
- 2017Evaluating four swing detection rules for mean reversion
- 2018Intraday breakout and mean reversion as one rule set
- 2018Evaluating rare consecutive-close mean-reversion entries
- 2020Moving-average baselines, price vetoes, and mean reversion
- 2020Two-dimensional FX scaling for trend and reversal systems