2015issue C0250-55
Condensed candlestick signatures
Each bar can be reduced to three range-normalized numbers and written as HO:HC:OL. The result is a compact signature that can be counted, marked on a chart, and stored for later probability work.
- Each bar reduces to high-to-open, high-to-close, and open-to-low, expressed as fractions of average daily range in the form HO:HC:OL.
- A chart overlay can tabulate the most common signatures and mark matching bars, and the same encoding can be written to a file so later work uses pattern counts rather than drawn candles.
- Frequent signatures can be ranked on one half of a series and applied on the other half. Keeping only the single most common signature is highly selective, while a larger top set produces more observations.
- Integer-binned signatures support frequency ranking, while unrounded high-open, high-close, and open-low ratios can stay continuous when grouping is not required.
A compact signature for every bar
Each bar can be reduced to three range-normalized numbers: high-to-open, high-to-close, and open-to-low. Together they form a compact signature.
Those three numbers are expressed as fractions of average daily range and written in the form HO:HC:OL.
Count, mark, and store the signatures
A chart overlay can both tabulate the most common signatures on the series and mark bars that match a chosen signature.
The same encoding can be written to a file so later probability work is done on pattern counts rather than on drawn candles.
A related earlier coding scheme stored body and shadow traits as bits in a single number. This method instead maps each bar onto a small set of comparable signatures.
Rank frequent signatures, then review later price change
One implementation splits history into equal in-sample and out-of-sample halves, ranks the most frequent signatures on the first half, then applies those signatures on the second half.
The number of top signatures kept is a control. Using only the single most common signature makes the sample very selective, while a larger top set produces more observations.
A default test path holds each observation for one bar and exits at that bar's close, with hold length adjustable. Exploration tables can report how often each signature appears and the subsequent one-to-four-period price change associated with it.
Editorial. Pattern recognition can treat the first-half ranking as an explicit baseline. Price-change categorization can then attach the later price change. Candlestick patterns supply the bar condition being counted. These readings are TradersWeek interpretations of the historical workflow, not claims made by the archive.
Average follow-through after the most common HO:HC:OL signatures on monthly SPY
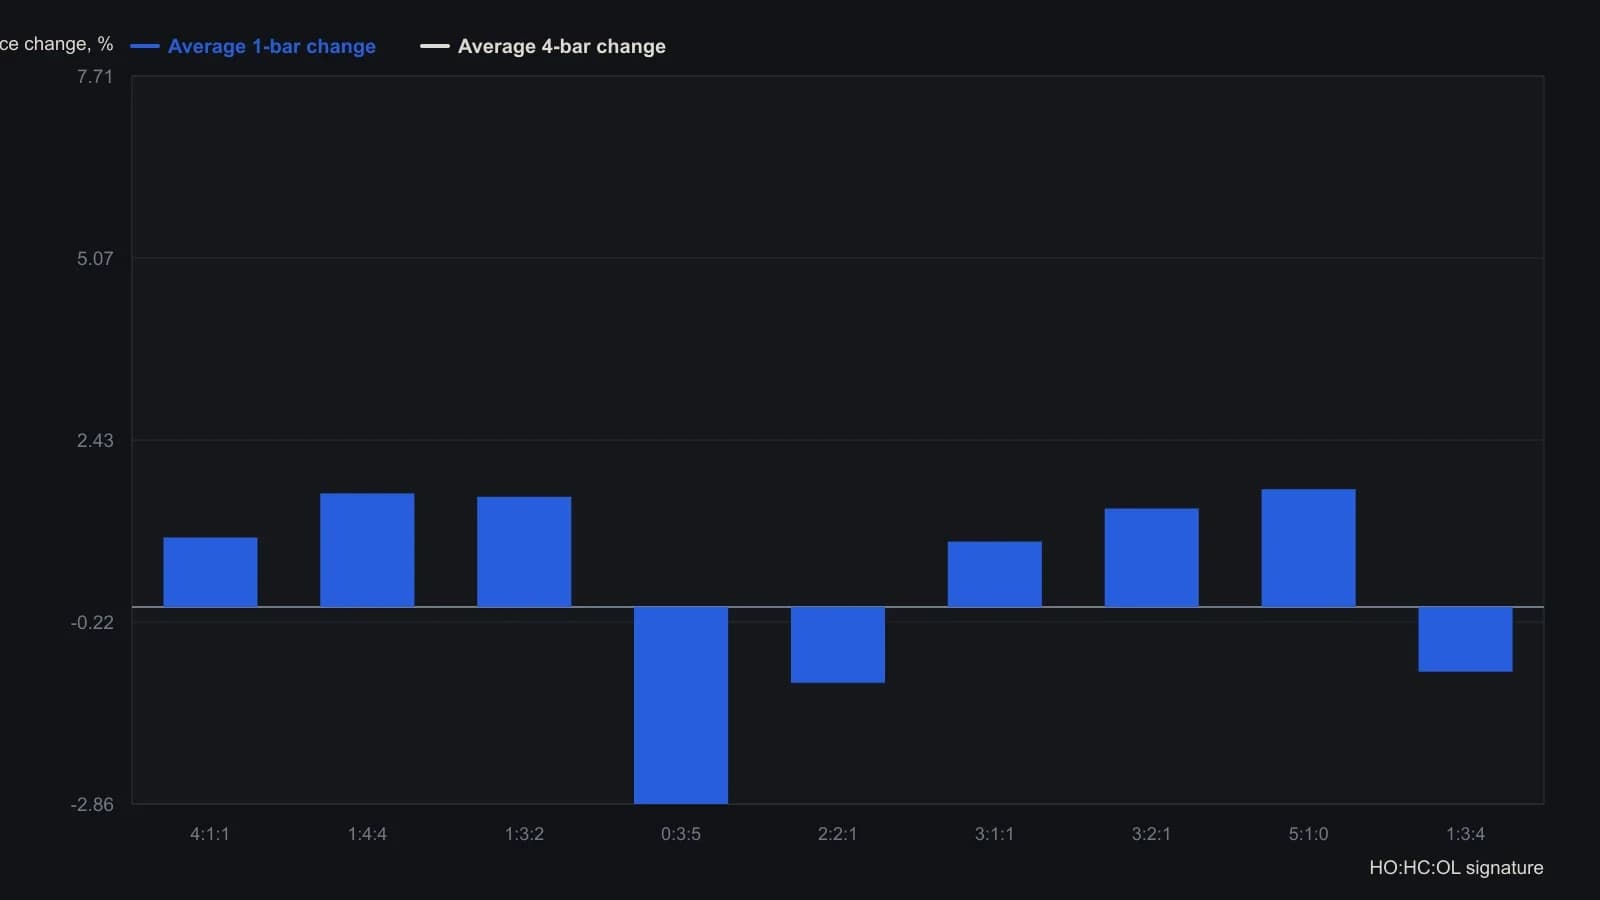
The study parameters on the chart are a 12-bar average range, five range segments and four look-forward periods. Cyan dots locate 4:1:1 bars. Sample starts with the February 1993 monthly bar.
Binned signatures or continuous ratios
Integer-binned signatures support frequency ranking, while unrounded high-open, high-close, and open-low ratios can be used as continuous inputs when grouping is not required.
All readings on this track · 25 readings
- 1986Construct a decision procedure that revises itself
- 1989Finish the volume checklist before scoring the breakout
- 1989Constructing supervised forecasts on moving averages
- 1991Candlestick labels as stacked construction tests
- 1992Walk-forward evaluation of weekly price-change patterns
- 1993RSI price pattern templates and open interest
- 1994Constructing a dual-net day-ahead index direction forecast
- 1994A clocked stochastic second crest with a window-high stop
- 1996Volatility-ratio, inside-day and narrow-range-4 entry construction
- 1998Sliding-window correlation for cup-and-handle construction
- 2000Constructing rectangles for breakout hypotheses
- 2001Turning one candle into a ranked numeric object
- 2002Fuzzy-scored chart patterns as testable rules
- 2002From hot-zones to an open-close-matrix
- 2003Volume pressure and a band-clearing breakout case
- 2004Evaluating chart patterns against price objectives
- 2004Cobweb turning points from price structure
- 2005Hybrid decision trees and pattern recognition for trend rules
- 2005Two-bar zone codes for testable pattern systems
- 2005Price bar pattern construction and next-bar frequency
- 2008Observe markets before following pattern or system rules
- 2012Treat a four-leg Fibonacci completion as an unpaid hypothesis
- 2014Hidden three-channel regression signals for stock and call option entries
- 2014A shared daily-chart-level framework for session trades and swing holds
- 2015Condensed candlestick signatures