2005issue C091-4
A moving-average short pullback that is only in scope in a decline
The archive treats declining, advancing, and basing markets as separate environments. A short setup that waits for a bounce to a 35-session average is reserved for a confirmed decline, with NASDAQ trendlines marking when that procedure is in force.
- Declining, advancing, and basing markets are framed as distinct environments that each need a dedicated procedure rather than one generic system.
- The short setup needs a downtrend, 15 consecutive closes below the 35-session average, a pullback to within 1% of that average, and a break of the setup session low before the short is entered on the following open.
- A break of an ascending NASDAQ trendline creates an uncertain interval. Short-side tools stay in force only after lower highs and lower lows allow a descending line to be drawn.
- The short-pullback procedure is intended for declining markets and is not applied while the market is advancing or basing.
Separate procedures for separate markets
The archive frames declining, advancing, and basing markets as distinct environments. Each environment needs a dedicated procedure rather than one generic system.
The moving-average short setup below is the declining-market procedure. The archive concludes that this short-pullback procedure is intended for declining markets and should not be applied while the market is advancing or basing.
The moving-average short setup
In this archive usage, the moving average is a 35-session simple average of closes. It is the pullback reference for a short-side setup that requires prior closes below the average and a retracement back to within a stated band of it.
The moving-average short setup requires a downtrend, 15 consecutive closes below the 35-day average, a pullback to within 1% of that average, average daily volume above 200,000 shares, a price above $15, and a stochastic reading below 80.
Trigger, entry, and cover
A valid setup on one session triggers only if the next session trades below that session's low, with the short entered on the following open.
In this archive usage, mean reversion is that short-side procedure: it waits for a bounce toward a declining average, then enters only if price breaks the prior session low. The bounce is treated as a temporary retracement inside a downtrend rather than a new uptrend.
The backtest exit used for comparison held the short for three days and covered at the open. Discretionary covers mentioned include approaching support, declining volume, or a close below the lower Bollinger Band.
An IBM session that met the rules
The IBM illustration met the pullback rules on March 31, 2005 and triggered the next session when price broke the prior low.
MAS short results in the January–October 2002 NASDAQ decline
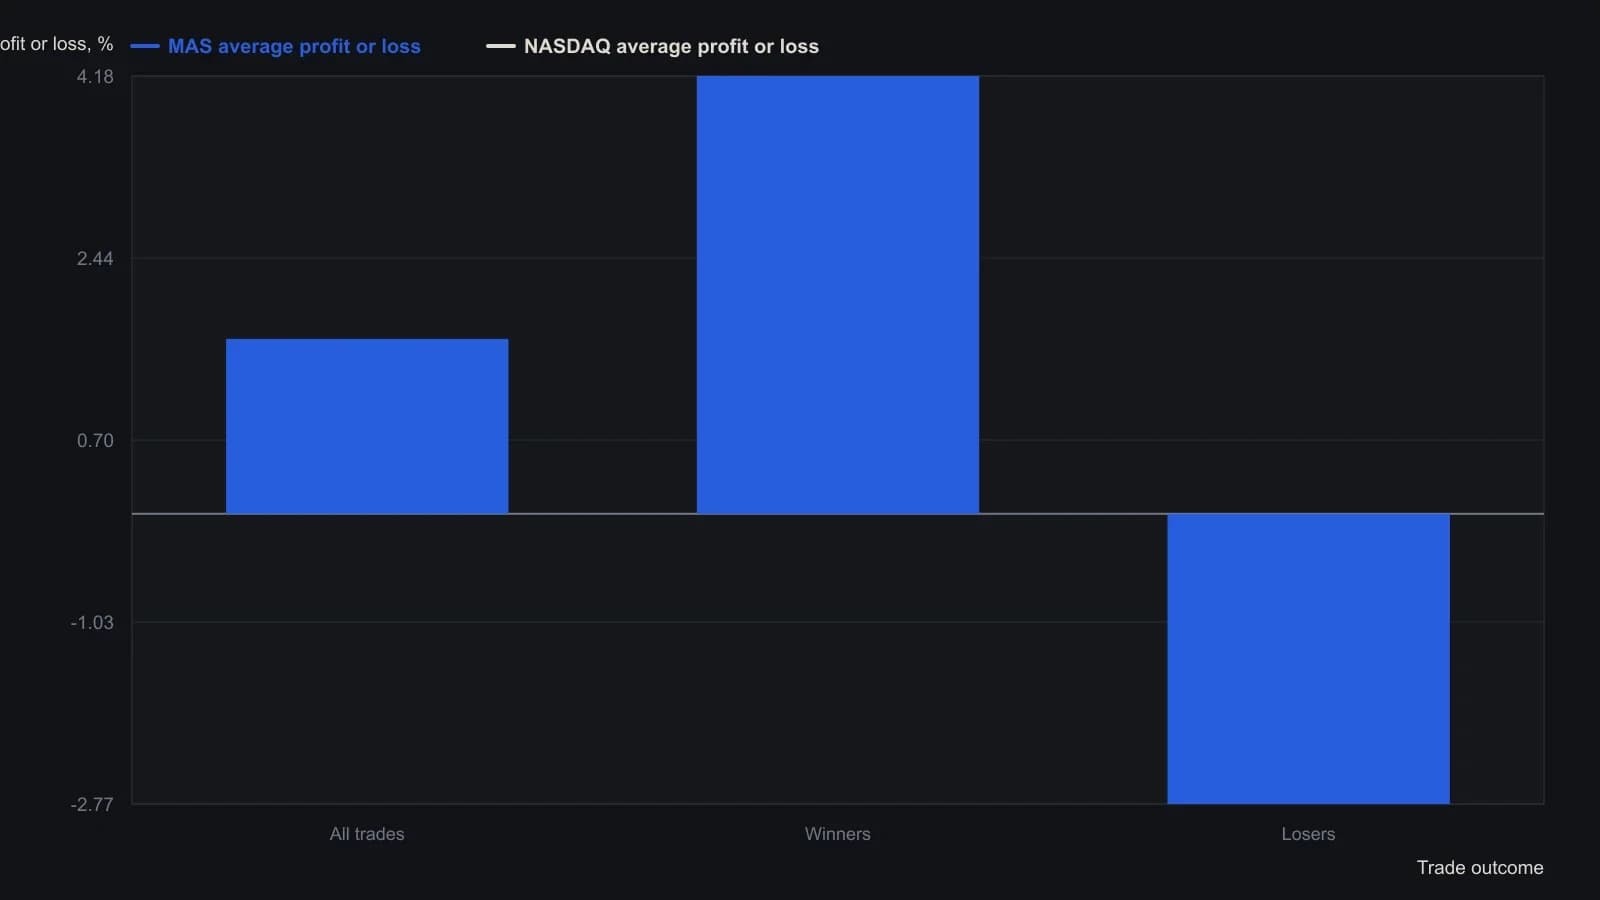
The software entered and covered at the open and held each short for three sessions. The run assumed all 83 signals were taken; the article treats the 145.47 percent annualized figure as a merit score, not a forecast.
Trendlines that keep the procedure in or out of scope
The first historical test window cited is the NASDAQ decline from January 18, 2002 to October 11, 2002, when the index moved from 2098 to 1108.
In this archive usage, a trendline is a line drawn across successive NASDAQ lows in an advance or highs in a decline. It is used as a regime switch that tells the trader when short-pullback tools are in or out of scope.
Trendline breaks on the NASDAQ are used to mark a change of condition. A break of an ascending line creates an uncertain interval. Only after lower highs and lower lows is a descending line drawn to keep short-side tools in force.
All readings on this track · 36 readings
- 1986A futures fade as one range, order, and secrecy procedure
- 1992Constructing the mass-index range-reversal procedure
- 1993Switch trend following and mean reversion with an equity-curve filter
- 1994Evaluating weekly trend-following and mean-reversion timing rules
- 1996Dual-horizon bands for a precious-metals cash switch
- 1997Constructing a moving regression oscillator
- 1997Regime-dependent long and short rules in mechanical systems
- 2002A same-session pair book with a morning-fixed volatility envelope
- 2004Combining noncorrelated trend and reversion systems
- 2004Failed-breakout overlays on trending markets
- 2004Rank rotation after a path split, then Robustness testing
- 2004Range-bound tape as a filter for trend and oscillator rules
- 2005A moving-average short pullback that is only in scope in a decline
- 2006Constructing an adaptive price zone from a double-smoothed range
- 2007Two-period relative strength index versus a one-week universe baseline
- 2008Building ETF mean-reversion entries with a two-bar washout
- 2008Rebuild a short-period stochastic as a premier stochastic oscillator
- 2008A three-market regime map for equity bounces and dollar cycles
- 2009Option trade adjustment as one testable procedure
- 2010Implied volatility as a May 2010 market-regime lab for the S&P 500
- 2011Treat a large one-day move as a classified event
- 2011Long-call exits, volatility regimes, and spread assignment
- 2011Pairing same-horizon oscillators with a walk filter
- 2012Two-bar band extreme entries with trailing stops
- 2012An eight-month average as a monthly gate for high-yield bonds
- 2014Complete the checklist before the trade
- 2014Coded rules should face one test, not a kinder sample
- 2015Build a mean-reversion basket from one correlation path
- 2015Index dip reversion is horizon and regime dependent
- 2016Treat the end of a trend as a handoff, not a broken system
- 2017A testable half-swing pullback for trend continuation
- 2017Evaluating four swing detection rules for mean reversion
- 2018Intraday breakout and mean reversion as one rule set
- 2018Evaluating rare consecutive-close mean-reversion entries
- 2020Moving-average baselines, price vetoes, and mean reversion
- 2020Two-dimensional FX scaling for trend and reversal systems