1989issue C121-2
Evaluate a contrary put-call premium ratio at a stated horizon
The archive workflow turns weekly average put and call premiums into a put-to-call ratio, codes contrary forecasts beyond a one standard deviation gate, and scores those forecasts at a stated horizon. Editorial interpretation: finish that chi-square check before the reading is allowed to change portfolio posture.
- Define each option premium as strike plus option cost minus the current underlying price, then form a weekly put-to-call premium ratio as market context rather than as a stand-alone options trade.
- Code a bullish forecast only when the ratio is more than one standard deviation above its mean, and a bearish forecast only when it is more than one standard deviation below, treating a high ratio as excessive bearish inclination.
- Score the same twelve-year weekly procedure on nearer-term higher-or-lower market calls and on market direction one year later, and keep those forecast horizons separate.
- Editorial interpretation: require a chi-square check of correct versus incorrect classifications before the ratio may change portfolio posture.
What the ratio measures
The evaluated series is the ratio of put premium to call premium. Each option premium is defined as the strike price plus the option cost, minus the current price of the underlying security.
The inputs are weekly average put premiums and weekly average call premiums. Those averages are later shown as a percentage ratio. The put-to-call premium ratio is one market-context reading rather than a stand-alone options trade.
Read it as market context
Editorial interpretation: use the ratio as a market-regime overlay. It describes excessive bullish or bearish inclination across a book. It is not a rule for sizing one options position.
Code a contrary forecast
Each week, a reading more than one standard deviation above the ratio mean was coded as a bullish forecast. A reading more than one standard deviation below the mean was coded as a bearish forecast.
That coding is a contrarian rule. A high put-to-call premium ratio was treated as excessive bearish inclination or a long-horizon oversold condition. A low ratio was treated as the opposite.
Score the same rule at a named horizon
The same twelve-year weekly procedure was scored on nearer-term higher-or-lower market calls and on market direction one year later. The forecast horizon is the interval between the weekly reading and the market direction being scored.
In the one-year-ahead direction test, the procedure issued 121 forecasts. Of those, 91 matched later market direction and 30 did not. The chi-square statistic reported for that one-year classification was 29.75.
A chi-square check compares correct versus incorrect directional classifications against a chance baseline over a defined sample of forecasts. Editorial interpretation: keep the nearer-term score and the one-year score as separate tests, and do not let the ratio change portfolio posture until the chi-square check for the chosen horizon is in hand.
Compare the plot with the average
The percentage plot of the put-to-call premium ratio was presented for visual comparison with the Dow Jones Industrial Average.
Put-to-call premium ratio, 1984–1988
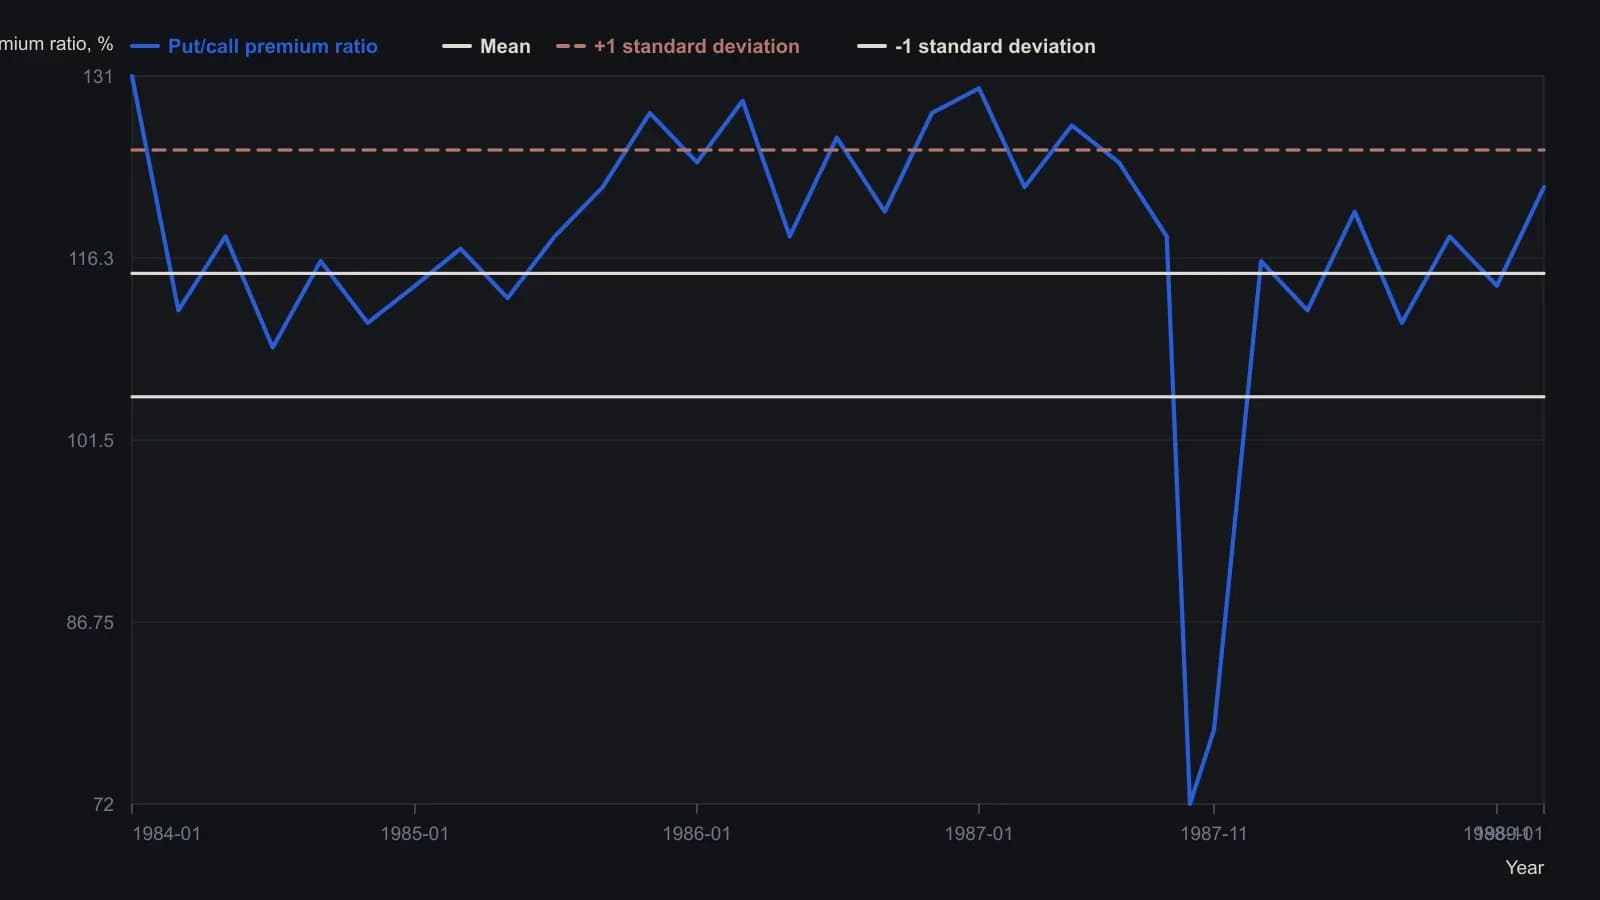
The source publishes no table. Weekly averages from the Options Clearing Corporation were sampled from the printed curve at roughly monthly spacing; y-values are approximate to the nearest percentage point. The two dashed guides are the ±1 standard-deviation thresholds used in the 12-year test.
All readings on this track · 17 readings
- 1987Testing price-volume agreement after percent reversal filters
- 1988Constructing chi-square tests for two-way price counts
- 1988Building consensus indicators with correlation and the chi-square test
- 1988Test edges against chance, not story
- 1988Constructing an advance-decline divergence oscillator
- 1989Evaluate a contrary put-call premium ratio at a stated horizon
- 1990A weekly resistance-index from hourly volume-per-point
- 1990Testing breadth above moving averages by horizon
- 1990Evaluating member versus odd-lot breadth
- 1990A chi-square test of split frequency histograms across price aggregations
- 1990Evaluating smoothed secondary counts with a chi-square test
- 1991Treat session high and low times as codes, then require a chi-square check
- 1991A signed hourly swing catalog as a next-session chi-square check
- 1992Constructing a chi-square test as a gate for two-way market records
- 1992Percent filters, log point-and-figure, and breadth residuals
- 1997Build a chi-square stationarity screen before you forecast
- 1998Timed breakout rules after a nested-bar contraction