2004issue C121-5
Range-bound tape as a filter for trend and oscillator rules
A four-stage market map treats a sideways tape as the setting in which short-horizon traders hunt names still in a clear advance or decline, rather than fading the index itself. Stages are read from a 30-week simple moving average, with a 150-day line as the daily counterpart. Oscillator turns are taken only after a slower moving-average convergence/divergence confirmation, with the stop set on that signal day.
- A sideways tape is the setting in which short-horizon traders hunt names still in a clear advance or decline, rather than fading the index itself.
- Stage labels come from a 30-week simple moving average, or from a 150-day average so the same labels can be read on a shorter chart.
- In a decline or an advance, an overbought or oversold oscillator turn is taken only after a slower moving-average convergence/divergence confirmation, with the stop set on that signal day.
- A name already far below its 150-day average is left unshorted, and the infrequent combined signals are applied across a large watch list that is reclassified over time.
A four-stage map and a sideways tape
A four-stage market map treats a sideways tape as the setting in which short-horizon traders hunt names still in a clear advance or decline rather than fading the index itself.
How stages are classified
Stage classification is defined against a 30-week simple moving average. Price above a rising average is an advance, price below a falling average is a decline, and sideways play around the average marks a range.
A short-horizon counterpart uses a 150-day average as the approximate daily equivalent of the 30-week line so stage labels can be applied on a shorter chart.
Continental Airlines weekly close versus its 30-week average
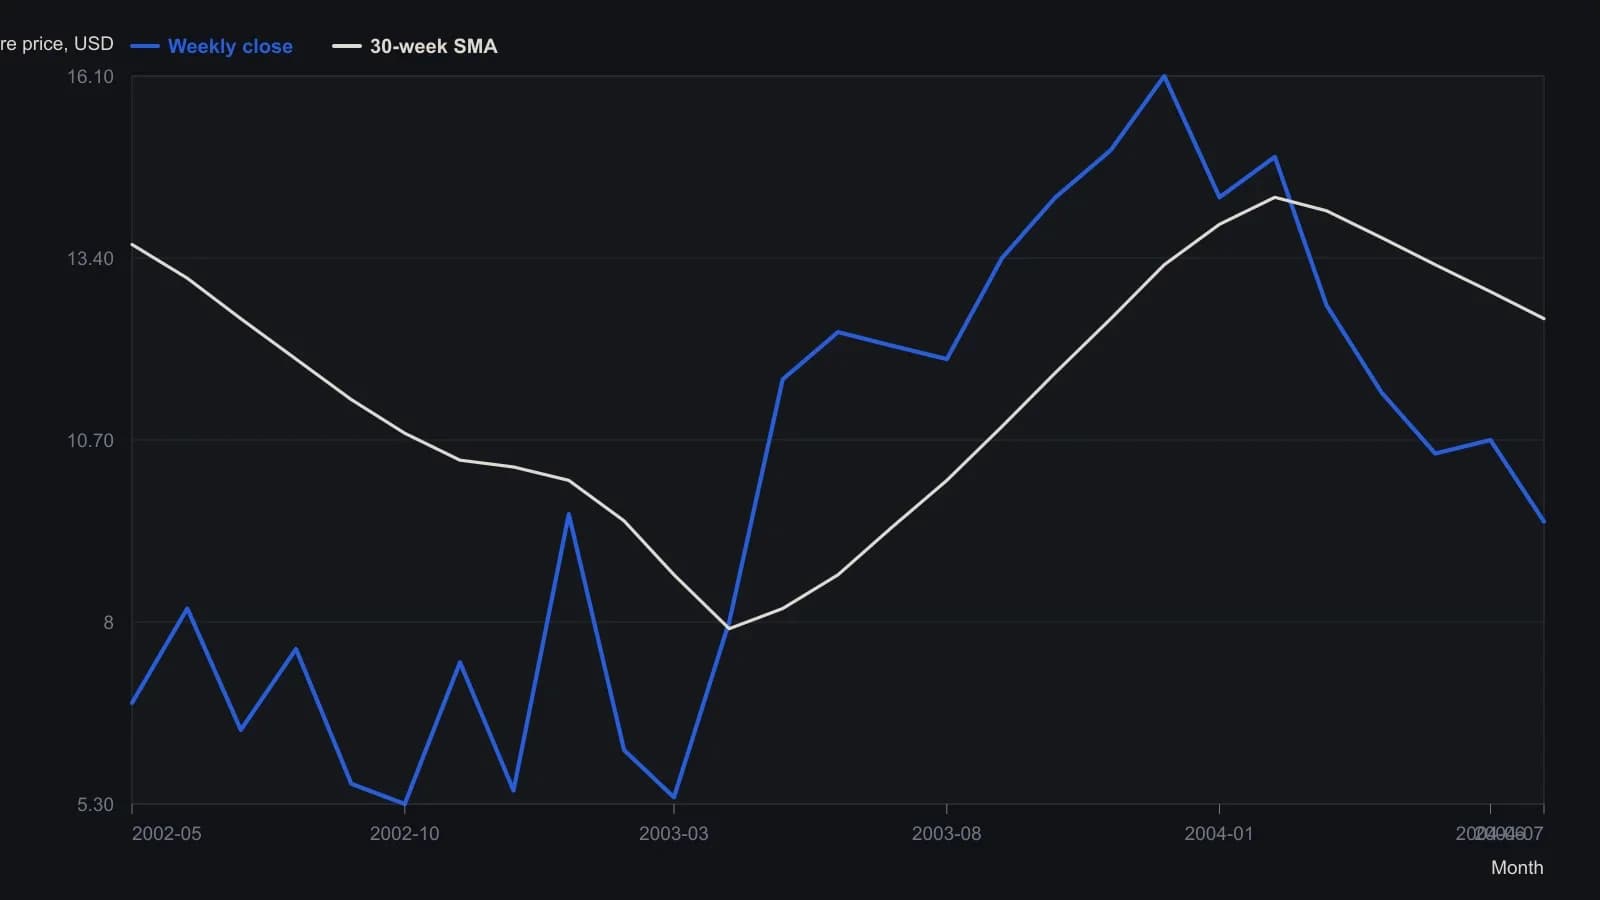
Intervening weekly closes are sampled about once a month from the candles and are approximate. The last close (9.49) and last 30-week average (12.50) are the printed 21 July 2004 figures.
Earlier warning at the end of a decline
A moving-average convergence/divergence reading can diverge from price near the end of a decline and thereby give earlier chart warning that a base is forming.
Entries, stops, and the reverse case
Inside the larger stage, the procedure waits for a stretched, then reversing, condition and turns that reversal into entry, stop, and exit rules. A lookback oscillator of ordered price marks overbought and oversold turns as a forecast of a short-horizon bounce or fade. A slower moving-average convergence/divergence reading then confirms that a stage-aligned turn has begun.
In a decline, the procedure waits for an overbought stochastic and commodity-channel turn, then takes the short only after a slower moving-average convergence/divergence sell, with a stop just above that signal day's high.
In an advance, the same oscillator pair is used in reverse. The procedure waits for an oversold bounce, enters on a moving-average convergence/divergence buy, and places the stop just below the signal day's low.
When not to short, and how names are reviewed
A name that has already fallen a large distance below its 150-day average is treated as too stretched to short immediately because bargain buying and short covering can force a rebound.
Because the combined stage-plus-oscillator signals are infrequent, the method is applied across a large watch list and names are periodically reclassified as still advancing or still declining.
All readings on this track · 36 readings
- 1986A futures fade as one range, order, and secrecy procedure
- 1992Constructing the mass-index range-reversal procedure
- 1993Switch trend following and mean reversion with an equity-curve filter
- 1994Evaluating weekly trend-following and mean-reversion timing rules
- 1996Dual-horizon bands for a precious-metals cash switch
- 1997Constructing a moving regression oscillator
- 1997Regime-dependent long and short rules in mechanical systems
- 2002A same-session pair book with a morning-fixed volatility envelope
- 2004Combining noncorrelated trend and reversion systems
- 2004Failed-breakout overlays on trending markets
- 2004Rank rotation after a path split, then Robustness testing
- 2004Range-bound tape as a filter for trend and oscillator rules
- 2005A moving-average short pullback that is only in scope in a decline
- 2006Constructing an adaptive price zone from a double-smoothed range
- 2007Two-period relative strength index versus a one-week universe baseline
- 2008Building ETF mean-reversion entries with a two-bar washout
- 2008Rebuild a short-period stochastic as a premier stochastic oscillator
- 2008A three-market regime map for equity bounces and dollar cycles
- 2009Option trade adjustment as one testable procedure
- 2010Implied volatility as a May 2010 market-regime lab for the S&P 500
- 2011Treat a large one-day move as a classified event
- 2011Long-call exits, volatility regimes, and spread assignment
- 2011Pairing same-horizon oscillators with a walk filter
- 2012Two-bar band extreme entries with trailing stops
- 2012An eight-month average as a monthly gate for high-yield bonds
- 2014Complete the checklist before the trade
- 2014Coded rules should face one test, not a kinder sample
- 2015Build a mean-reversion basket from one correlation path
- 2015Index dip reversion is horizon and regime dependent
- 2016Treat the end of a trend as a handoff, not a broken system
- 2017A testable half-swing pullback for trend continuation
- 2017Evaluating four swing detection rules for mean reversion
- 2018Intraday breakout and mean reversion as one rule set
- 2018Evaluating rare consecutive-close mean-reversion entries
- 2020Moving-average baselines, price vetoes, and mean reversion
- 2020Two-dimensional FX scaling for trend and reversal systems