2020issue C0724-29
Two-dimensional FX scaling for trend and reversal systems
A mechanical construction in which a continuation signal and a fade signal share one volatility-and-threshold surface, so the zigzag-threshold that defines a segment stays aligned with expected segment payoff and expected segment duration as market scale changes.
- Self-similar FX series can be viewed at different bar intervals, and scale-independent structure is used to forecast expected trend size and expected trend duration for model construction.
- A directional-change count and the average return per zigzag segment are mapped to the same zigzag-threshold, then joined with volatility so expected payoff and the threshold stay in the same price-change units.
- Two-dimensional-scaling replaces separate one-scale relations with joint surfaces; both mechanical procedures invert the return surface and read expected segment-length from the directional-change surface.
- The trend-strategy enters with a newly declared segment once the close-to-close move clears the threshold, while the reversal-strategy fades when the unfinished segment exceeds the predicted averages in both length and price change.
Read size and duration from scale
Self-similar FX series can be viewed at different bar intervals. Self-similarity is a structure that keeps the same form when the observation altitude or the chart interval changes. That scale-independent structure is used to forecast expected trend size and expected trend duration for model construction.
An early FX scaling-law links mean absolute logarithmic return to the sampling interval through a drift-exponent. The drift-exponent is the power in that link. The early relationship is treated as historically useful rather than as a practical trading rule.
Map count and payoff to one zigzag-threshold
A later scaling-law maps average directional-change count, or ndc, to a zigzag-threshold that starts a new zigzag segment. A directional-change is a declared up or down turn in a zigzag path once price has moved a set threshold from the extreme of the current segment. Historical observations were described as fitting the power-law form of that later link.
Average return per zigzag segment is also mapped to the same zigzag-threshold. Expected segment payoff and the threshold that defines the segment therefore stay in the same price-change units, usually stated in pips.
Add volatility and collapse to joint surfaces
Volatility, defined as the average absolute close-to-close bar change and stated in pips, is introduced as a second measurement scale. The directional-change count and, more weakly, average segment return each follow a scaling-law in that measure.
Separate one-scale equations are collapsed into two joint surfaces under the assumption that the power-law slopes in threshold and in volatility stay common across regions. That joint form is two-dimensional-scaling: expected counts or expected returns depend on threshold and volatility at the same time, replacing the separate one-scale equations.
After those surfaces are fit, average directional-change count and therefore average segment-length can be read from measured volatility and a chosen zigzag-threshold. Segment-length is the average number of bars per zigzag segment, obtained by dividing the sample size by the directional-change count. In the historical workflow, predicted counts were presented as agreeing with the measured counts.
EURUSD hourly directional-change count versus zigzag threshold
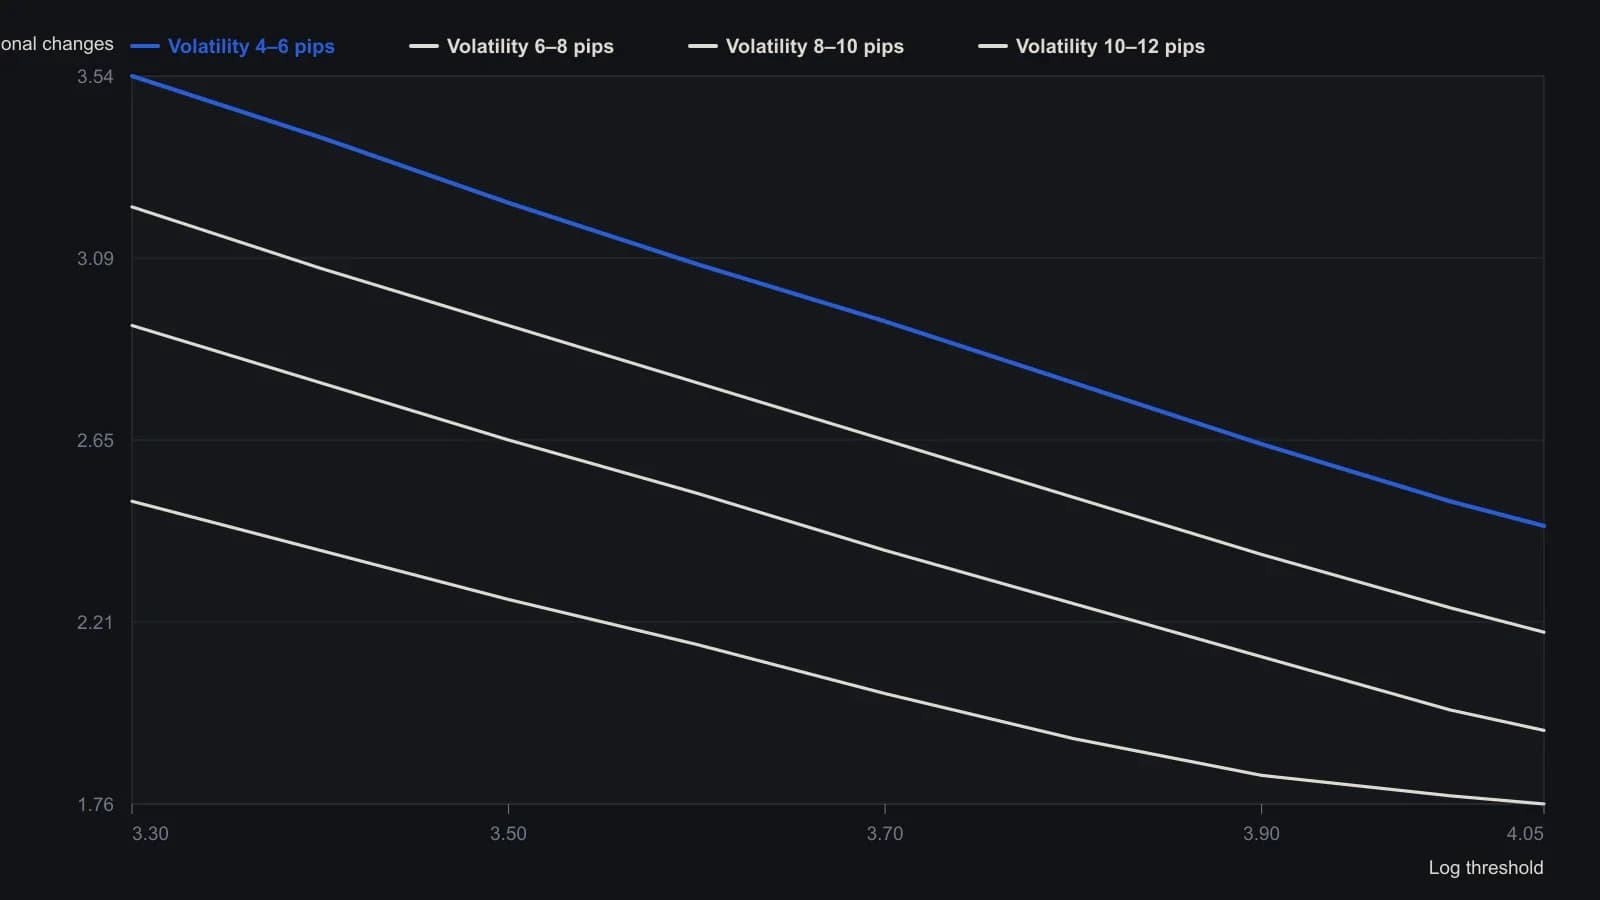
Source used 350-bar hourly windows. Threshold and volatility are in pips; both axes are the logs printed on the figure. Series follow the published legend: circles 4–6, plus 6–8, stars 8–10, crosses 10–12.
Invert the return surface, then read duration
Both mechanical procedures invert the joint return surface to set the zigzag-threshold from a chosen expected return and current volatility. They then read expected segment-length from the joint directional-change surface. The zigzag-threshold is allowed to move as volatility changes.
The trend-strategy is a mechanical rule that enters with a newly declared zigzag segment once the close-to-close move clears the threshold. It uses the predicted averages together with the unfinished segment's length in the decision.
The reversal-strategy is a mechanical rule that fades the unfinished segment once its length and price change both exceed the scaling-law averages. The same pair of surfaces supplies those averages for both procedures.
All readings on this track · 36 readings
- 1986A futures fade as one range, order, and secrecy procedure
- 1992Constructing the mass-index range-reversal procedure
- 1993Switch trend following and mean reversion with an equity-curve filter
- 1994Evaluating weekly trend-following and mean-reversion timing rules
- 1996Dual-horizon bands for a precious-metals cash switch
- 1997Constructing a moving regression oscillator
- 1997Regime-dependent long and short rules in mechanical systems
- 2002A same-session pair book with a morning-fixed volatility envelope
- 2004Combining noncorrelated trend and reversion systems
- 2004Failed-breakout overlays on trending markets
- 2004Rank rotation after a path split, then Robustness testing
- 2004Range-bound tape as a filter for trend and oscillator rules
- 2005A moving-average short pullback that is only in scope in a decline
- 2006Constructing an adaptive price zone from a double-smoothed range
- 2007Two-period relative strength index versus a one-week universe baseline
- 2008Building ETF mean-reversion entries with a two-bar washout
- 2008Rebuild a short-period stochastic as a premier stochastic oscillator
- 2008A three-market regime map for equity bounces and dollar cycles
- 2009Option trade adjustment as one testable procedure
- 2010Implied volatility as a May 2010 market-regime lab for the S&P 500
- 2011Treat a large one-day move as a classified event
- 2011Long-call exits, volatility regimes, and spread assignment
- 2011Pairing same-horizon oscillators with a walk filter
- 2012Two-bar band extreme entries with trailing stops
- 2012An eight-month average as a monthly gate for high-yield bonds
- 2014Complete the checklist before the trade
- 2014Coded rules should face one test, not a kinder sample
- 2015Build a mean-reversion basket from one correlation path
- 2015Index dip reversion is horizon and regime dependent
- 2016Treat the end of a trend as a handoff, not a broken system
- 2017A testable half-swing pullback for trend continuation
- 2017Evaluating four swing detection rules for mean reversion
- 2018Intraday breakout and mean reversion as one rule set
- 2018Evaluating rare consecutive-close mean-reversion entries
- 2020Moving-average baselines, price vetoes, and mean reversion
- 2020Two-dimensional FX scaling for trend and reversal systems