2010issue C1167-68
Implied volatility as a May 2010 market-regime lab for the S&P 500
This archive article uses 7 May 2010 and 21 May 2010 as a classroom check. It places a 30-day S&P 500 implied-volatility reading against a 40-day simple moving average, then writes the gap as one mean-reversion procedure for a short-term reversal.
- The implied-volatility index is a 30-day forward-looking expectation built from a range of S&P 500 index calls and puts.
- A 40-day simple moving average of that index is the explicit baseline for judging when the reading has moved far from its recent path.
- Large gaps from that average are treated as mean-reversion setups and as conditions under which a short-term S&P 500 reversal becomes more likely.
- Chart notes for 7 May 2010 and 21 May 2010 place the S&P 500 at downward extremes just as the implied-volatility gap flags a short-term upside reversal.
What the case is for
This article treats the May 2010 S&P 500 air pocket as a classroom lab. The lab asks how one implied-volatility reading can be placed in a weeks-to-months market-regime context.
Editorial interpretation: TradersWeek reads the archive as a comparison of that reading with an explicit moving-average baseline, then as a single mean-reversion procedure that can be checked on the same two session dates. That framing is editorial. It is not an archive claim.
The implied-volatility reading
The featured implied-volatility index is built from a range of S&P 500 index option implied volatilities. It uses both calls and puts. It is described as a 30-day forward-looking volatility expectation.
Implied volatility, in the vocabulary of this article, is that forward-looking market-regime reading taken from the 30-day expected-volatility index.
The moving-average baseline
A 40-day simple moving average of that index is the explicit baseline used to judge when the reading has moved far from its recent path.
Moving average, here, means that 40-day simple average of the implied-volatility series, used to judge how far the current reading has traveled.
The gap as a mean-reversion rule
Large gaps from that moving average are treated as mean-reversion setups, with the index expected to trade back toward the average.
Those same gaps are presented as conditions under which a short-term reversal in the S&P 500 becomes more likely. Mean reversion is the rule that treats a large gap between the implied-volatility index and its 40-day average as a testable short-term reversal setup. A short-term reversal is a brief turn in S&P 500 direction that the procedure associates with implied volatility stretching far from its moving-average baseline.
Two sessions that can be checked
Chart notes for 7 May 2010 and 21 May 2010 show the implied-volatility index trading far from its 40-day simple moving average.
On those two dates the S&P 500 is shown at downward extremes immediately before the implied-volatility reading flags a short-term upside reversal.
VIX versus its 40-day average through May 2010
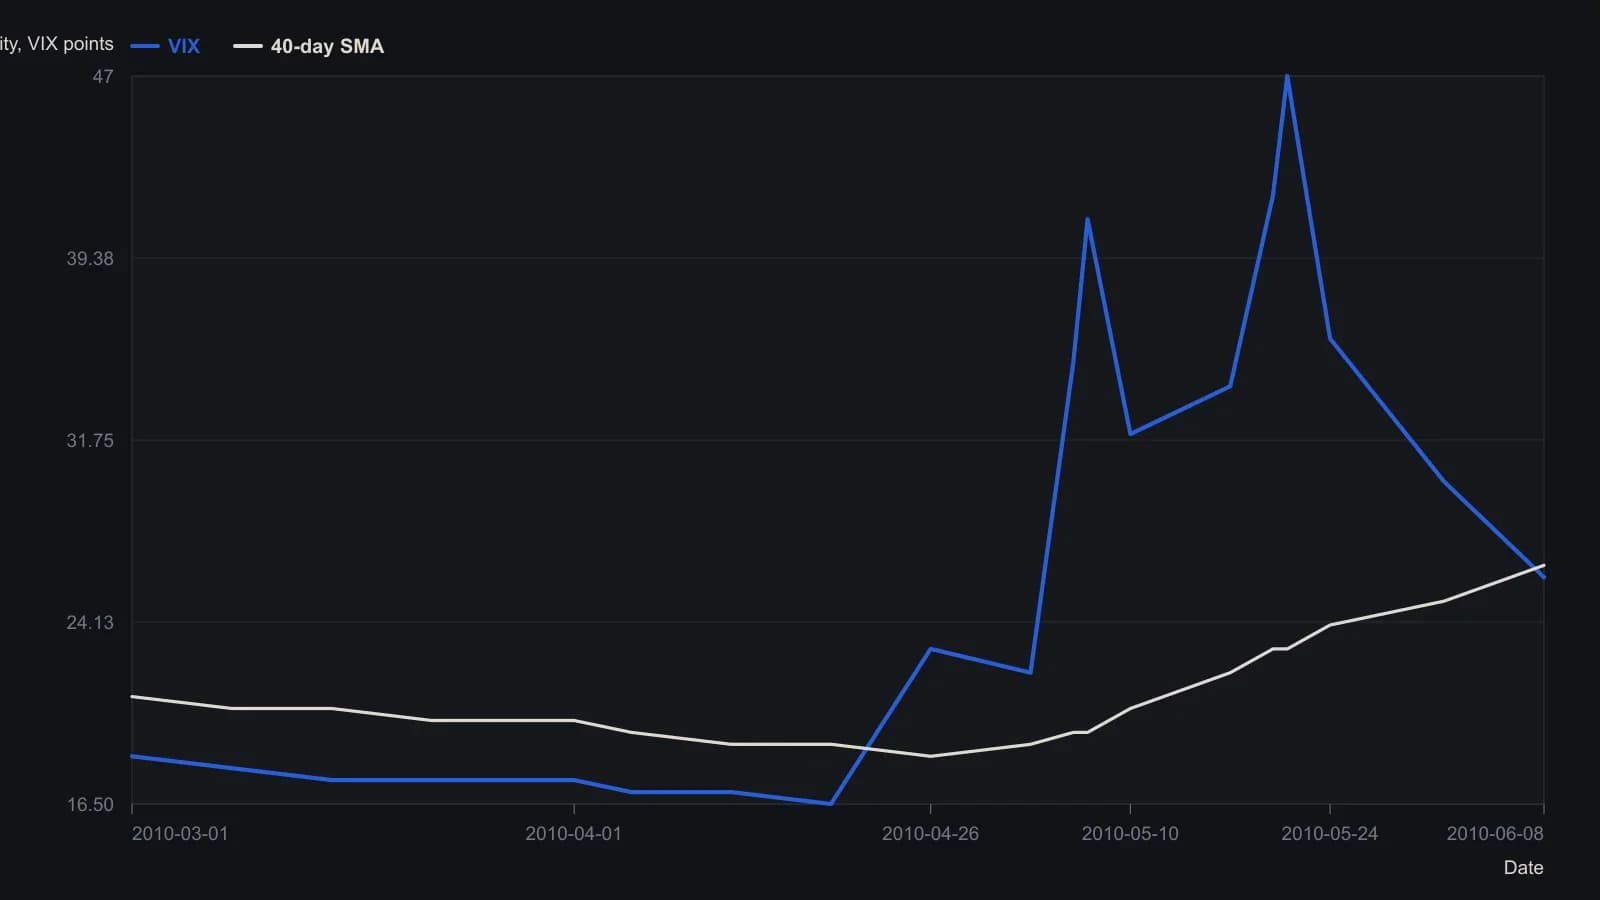
Read off candlesticks on a small raster and rounded to the nearest half-point. The pane prints a last value of 21.31 as of 3 September 2010, which sits outside the March–8 June window on the x-axis and is not plotted. The average is the 40-day simple moving average drawn on that pane.
The crowd-extreme input
Extreme crowd fear or greed after a move that has gone too far, too fast is the market-state input the reversal procedure is meant to detect. Crowd extreme is that staging condition for a short-term reversal.
All readings on this track · 36 readings
- 1986A futures fade as one range, order, and secrecy procedure
- 1992Constructing the mass-index range-reversal procedure
- 1993Switch trend following and mean reversion with an equity-curve filter
- 1994Evaluating weekly trend-following and mean-reversion timing rules
- 1996Dual-horizon bands for a precious-metals cash switch
- 1997Constructing a moving regression oscillator
- 1997Regime-dependent long and short rules in mechanical systems
- 2002A same-session pair book with a morning-fixed volatility envelope
- 2004Combining noncorrelated trend and reversion systems
- 2004Failed-breakout overlays on trending markets
- 2004Rank rotation after a path split, then Robustness testing
- 2004Range-bound tape as a filter for trend and oscillator rules
- 2005A moving-average short pullback that is only in scope in a decline
- 2006Constructing an adaptive price zone from a double-smoothed range
- 2007Two-period relative strength index versus a one-week universe baseline
- 2008Building ETF mean-reversion entries with a two-bar washout
- 2008Rebuild a short-period stochastic as a premier stochastic oscillator
- 2008A three-market regime map for equity bounces and dollar cycles
- 2009Option trade adjustment as one testable procedure
- 2010Implied volatility as a May 2010 market-regime lab for the S&P 500
- 2011Treat a large one-day move as a classified event
- 2011Long-call exits, volatility regimes, and spread assignment
- 2011Pairing same-horizon oscillators with a walk filter
- 2012Two-bar band extreme entries with trailing stops
- 2012An eight-month average as a monthly gate for high-yield bonds
- 2014Complete the checklist before the trade
- 2014Coded rules should face one test, not a kinder sample
- 2015Build a mean-reversion basket from one correlation path
- 2015Index dip reversion is horizon and regime dependent
- 2016Treat the end of a trend as a handoff, not a broken system
- 2017A testable half-swing pullback for trend continuation
- 2017Evaluating four swing detection rules for mean reversion
- 2018Intraday breakout and mean reversion as one rule set
- 2018Evaluating rare consecutive-close mean-reversion entries
- 2020Moving-average baselines, price vetoes, and mean reversion
- 2020Two-dimensional FX scaling for trend and reversal systems