2017issue C0720-21
Constructing delayed buy-stops on bull flags and pennants
A bull-flag or pennant is built from a flagpole, an unfinished pause, and a delayed-breakout. The long hypothesis becomes live only when a buy-stop sits above the next session high, with a trailing-stop already sized.
- A bull-flag is a congestion band, often with a slight downward tilt, sitting on a sharp upward flagpole; a pennant is the same sequence with price contracting into a triangle.
- A preferred first filter is range-expansion: the flagpole should be at least as tall as the prior day's range before the pause is treated as a candidate.
- Confirmation is delayed until the session after the pause is first spotted, then a buy-stop is parked $0.50 above that session's high, not inside the pause.
- Open risk is bounded with a $2 initial stop that is also used as a trailing-stop, and the swing is described as typically lasting five to 15 days.
Construction rather than a visual guess
In editorial terms, a bull-flag or pennant is treated here as a construction sequence rather than a shape guessed from the chart. The historical workflow first requires a flagpole, then leaves the pause unfinished until the next session, and only then converts the drawing into a falsifiable long hypothesis.
A bull-flag is constructed as a congestion band, often with a slight downward tilt, sitting on a sharp upward flagpole. A pennant is the same sequence with price contracting into a triangle. Either structure is sufficient. The flagpole is the sharp upward impulse that must appear before any bull-flag or pennant consolidation is treated as a candidate structure.
Require range-expansion on the flagpole
A preferred filter is range-expansion: a flagpole at least as tall as the prior day's range. The stated rationale is that range-expansion draws additional participation to a later breakout.
The long hypothesis may follow a first impulse that has already printed. That impulse is still required before the pause is read as a bull-flag or pennant.
Leave the pause unfinished until the next session
The long hypothesis is placed above the high of the completed flag or pennant, not inside the pause. Confirmation is delayed until the session after the pause is first spotted.
A buy-stop is then parked $0.50 above that session's high so entry occurs only if price clears resistance.
TTWO 15-minute path through the flagpole, bull flag, and pennant
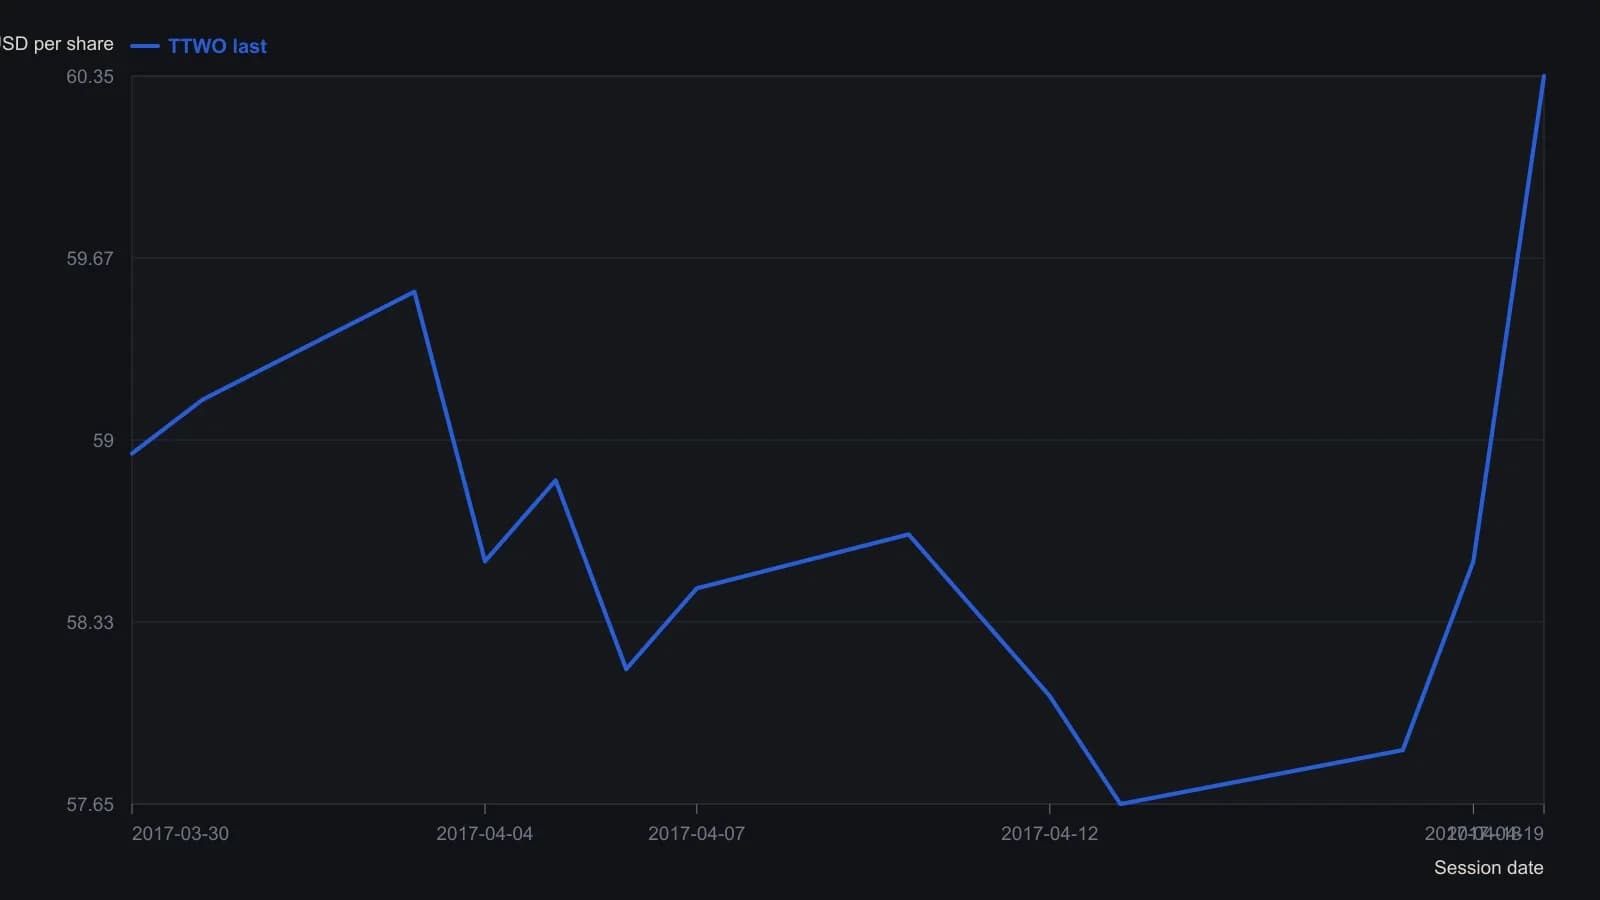
Digitized from the Figure 1 candlestick raster. No OHLC table is printed. Y-values are approximate to about 0.05–0.10 dollars. The $0.50 buy-stop and $2 trailing-stop are stated in the text and are not plotted. Volume histogram at the bottom was not recovered.
Bound open risk with a trailing-stop
Open risk is bounded with a $2 initial stop that is also used as a trailing-stop. That same dollar stop both defines initial risk and is then moved to keep remaining exposure bounded while the swing is open.
The swing is described as typically lasting five to 15 days.
The construction screen
The construction screen uses a 15-day window of 15-minute candlesticks and share prices from $20 to $70. Either a flag or a pennant is sufficient.
All readings on this track · 26 readings
- 1986Constructing bounded relative-strength overlays from oscillator limits
- 1989Point-and-figure fulcrum, count, and flag as three jobs
- 1996The high, tight flag as a three-checkpoint continuation exam
- 2000Test chart patterns with confirmation, not names
- 2001Failed chart patterns as reverse breakout signals
- 2002Ascending triangle and flag: a three-checkpoint QQQ case study
- 2002Two-stage chart reading after breakouts
- 2002The second pattern after a breakout
- 2003Building flags, pennants, and triangles as continuation pauses
- 2003When trendline channels age into a wedge or a break
- 2004Bearish chart patterns need confirmation before the turn
- 2004Constructing flags, pennants, and triangles from swing pivots
- 2005Constructing flag and pennant rules from pole to exit
- 2005Fanline construction for testing trend health
- 2005When flag-and-pennant breakout scans fail a measurement audit
- 2006Testing a bear-flag target after the pause is confirmed
- 2007Homebuilder rebound as a bear-flag, trendline, and volume case study
- 2008Completed chart patterns as reward-to-risk arithmetic
- 2012Reading this file
- 2012Reading regime change: when to stop trading
- 2014Intraday flag construction with breakout and stop rules
- 2015Lock lookback and chart scale before you mark a flag or pennant
- 2017Constructing delayed buy-stops on bull flags and pennants
- 2018Copy an ABC swing as a ruler, then test flags and Fibonacci degree
- 2019Failed flags, pennants, and triangles as a completed experiment
- 2020Confirming candlestick and flag signals on a weekly chart