2007issue C031-4
Journal a gap breakout as three sequential gates
A completed trade can be journaled as three sequential gates: whether the opening gap is a usable volatility hypothesis, whether structure actually broke, and when the stop must be walked higher. The historical WYNN workflow shows how those tests turn a journal entry into a reusable hypothesis rather than a recap.
- An opening gap is a volatility hypothesis that can screen a long or short setup. It is not, by itself, the completed entry test.
- Breakout confirmation is a separate gate: price must clear a predefined structure, such as a neckline, before a watchlist name becomes an active long or short.
- A fifty-two-week-screen only builds the watchlist. Buying every new high can coincide with the extreme print of the move.
- When the trade is working, raise a trailing-stop to the measured-move or later structure so the exit stays defined as price extends.
Three gates, not a recap
Editorial framing. A finished journal entry is useful only if the same tests can be run again. This article reads the archive workflow as three sequential gates: whether the opening gap is a usable volatility hypothesis, whether structure actually broke, and when the stop must be walked higher.
Each gate has its own pass or fail. Failing an earlier gate should stop the later ones from being written as if they stood alone. The archive records one completed trade. The three-gate order is a TradersWeek interpretation of that workflow, not a claim the archive tested a system.
Gate one: is the gap a usable hypothesis
Gap-analysis reads an opening discontinuity versus the prior close as a buyer-seller imbalance and a volatility shift that can time a setup. An opening gap away from the prior close is treated as that imbalance and as a volatility injection that can screen a long or short setup.
A fifty-two-week-screen is a first-pass scan for names printing yearly highs or lows. It is used only to build a watchlist and not as the entry itself. A new 52-week high or low is treated as a watchlist filter, not an automatic entry, because buying every new high can coincide with the extreme print of the move.
Gate two: did structure actually break
Breakout is confirmation that price has cleared a predefined structure, such as a neckline or prior high, converting a watchlist name into an active long or short hypothesis. The gap times the idea. The structure break is the separate test that the idea is live.
After WYNN printed new 52-week highs, failed to hold above 80, repeatedly tested a 200-day exponential moving average, and formed an inverted head-and-shoulders, a 6 November 2006 opening gap through the neckline was the breakout used to enter long in the first 30 minutes.
Editorial note on sequence. The fifty-two-week print only put the name on the list. The failed hold above 80, the repeated 200-day tests, and the inverted head-and-shoulders defined the structure. Only the opening gap through the neckline converted the watchlist name into the active long.
Gap-floor invalidation and the measured-move
When an upside gap is modest, the gap-floor on a closing basis is the support that must hold. A close beneath it is the exit. In the illustrated trade the stop sat at 73.50 or lower.
The first objective was a measured-move equal to the depth of the inverted head-and-shoulders, projected from the neckline. That depth was 11.68, from a 72.50 neckline minus a 60.82 low, added to the neckline for an 84.18 target. The September high at 78.86 was flagged as a test that could force an earlier exit if bearish signals appeared.
Holding through a resistance test
On the fourth session, price traded through 80 but closed at 78.80 at the September high. The long was kept because the post-gap swing still made a new high, and the next session cleared that former resistance.
Editorial reading. The close back at the September high was not treated as a failed breakout while the post-gap swing was still making a new high. The following session then cleared that former resistance.
Gate three: when the stop must walk higher
A trailing-stop is a stop that is raised to a measured objective or later structure once the trade is working, so the exit stays defined as price extends.
After entry, a weekly chart supplied horizon context: a new two-year high on strong volume and a bullish directional-movement-index crossover. A later move back under the April peak at 80.19 was defined as failure of old resistance to act as support.
After a later high-volume gap through 84.18, the trailing stop was raised to that measured target and exit waited on bearish action. Once price cleared 90 and looked overbought, short-term gains were taken on the view that the next path was sideways or lower toward rising averages.
Editorial placement. The weekly context did not replace the daily gates. It framed how long the working hypothesis could stay open, and it defined a later failure if old resistance could not hold as support.
WYNN daily price versus the $84.18 measured-move target
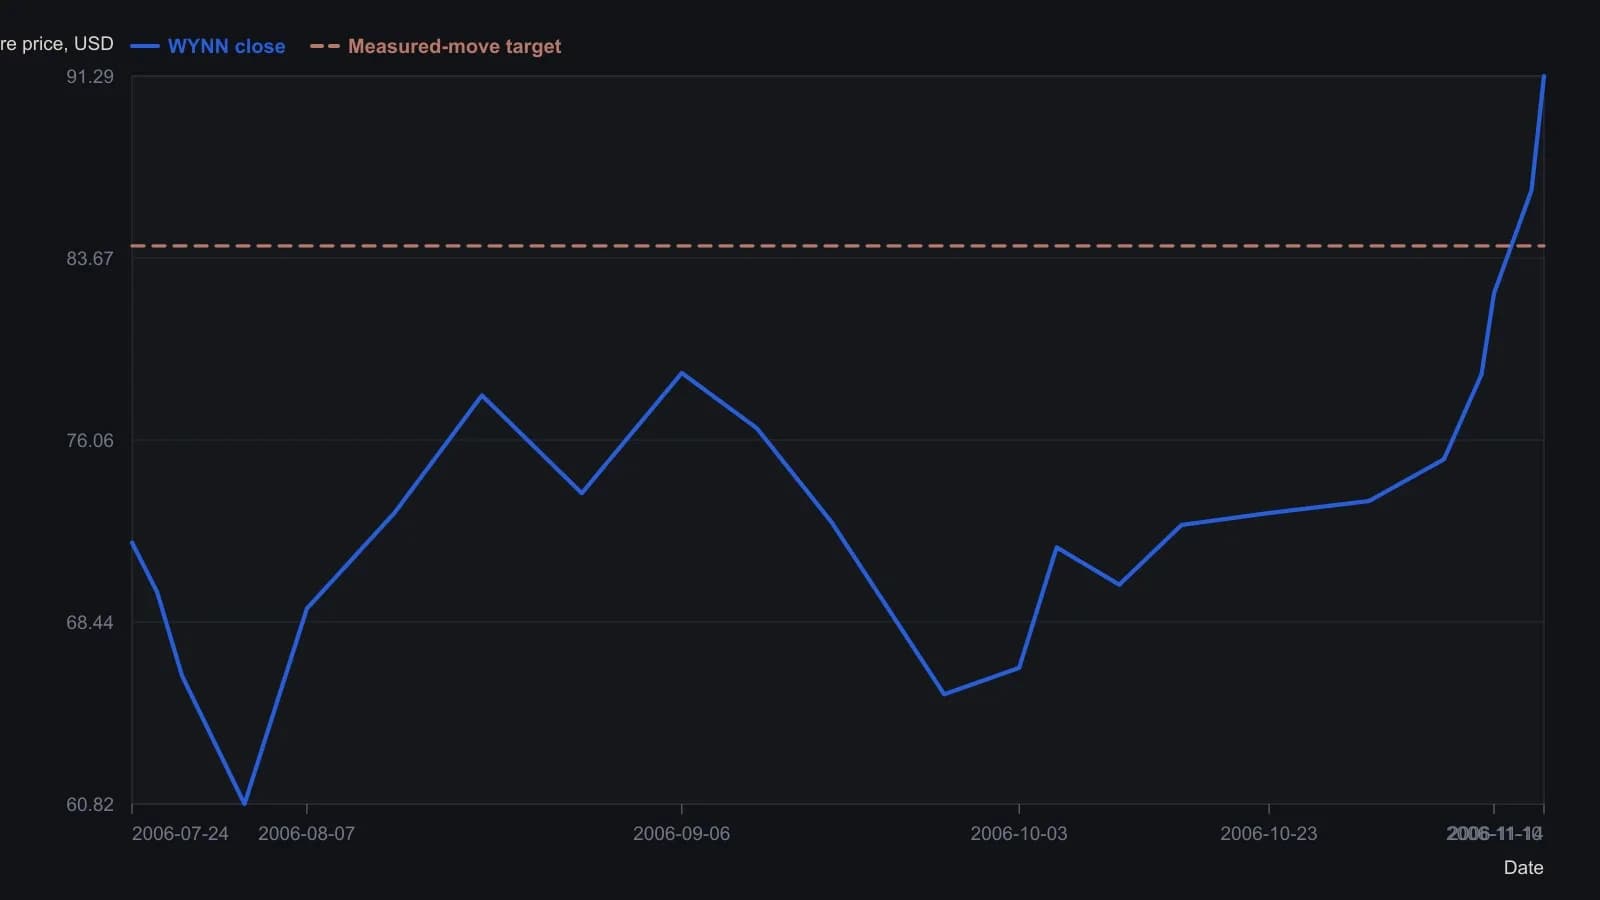
Dates for on-chart callouts were aligned to the printed day axis and may be off by a session or two. Candles without a printed label were read only to the nearest half-dollar, and quiet October sessions were left out, so the mid-base is thinner than the real daily file. The 84.18 line is the article’s calculated target, not a plot on the original chart.
All readings on this track · 11 readings
- 1987Broken bias: stops, cash flow and unfilled gaps
- 1999A surviving weekly gap still needs a confirmation-breakout
- 2000Repeatable volume-price silhouettes as falsifiable hypotheses
- 2004Constructing pivot commonality across timeframes
- 2005A finished crude-oil top as a classroom for necklines, candles, and gaps
- 2007Journal a gap breakout as three sequential gates
- 2008Same-open kicker as a two-bar reversal case
- 2010Filtered gap follow-through entry rules
- 2010Cloudbank overhead resistance and breakout recovery
- 2015Post-exit cooldown as a system rule
- 2018Classifying chart gaps before fill or follow