2012issue C1231-38
A weekly-close test of impulse, correction, and the 61.8% stop
This case study teaches a weekly-close experiment: a swing that stays inside 61.8% of the prior five-wave impulse remains a correction, and a weekly close beyond that line reclassifies the old trend as finished so a trailing 61.8% stop can stay with the next impulse.
- A five-wave impulse names the dominant trend on the time frame being labeled. A three-wave corrective pattern is treated as unfinished until it is fully retraced.
- Completed countertrend swings on the weekly S&P 500 sample sat in the 38.2% to 61.8% band of the prior impulse. Only six of 29 exceeded 61.8%, which is why a weekly close beyond that line is treated as a trend-change signal.
- After that signal, a trailing stop is ratcheted to 61.8% of the newest trending swing or of a completed five-wave sequence, and only a weekly close counts as a violation.
- Impulse-wave labeling can keep that stop on a whole five-wave decline instead of exiting at each completed five-wave, which in the 2007 to 2009 illustration left the short in place until the decline ended.
How impulse and correction are named
Five-wave impulse structures are used to name the dominant trend on the time frame being labeled. They are described as unfolding quickly with little opposing resistance.
Three-wave corrective structures are treated as labored and often more sideways than fully opposite the trend. They are treated as evidence that the previously dominant trend is still intact.
Once a correction is complete it is treated as fully retraced, after which the dominant trend resumes. Every swing is classified as either impulsive or corrective.
Why the weekly line sits at 61.8%
On a weekly S&P 500 chart spanning about 17 years from 1996, completed countertrend swings large enough to appear on that scale were marked in the 38.2% to 61.8% band of the immediately preceding trending leg.
In that weekly sample of 29 countertrend moves, only six exceeded a 61.8% retrace of the prior impulse. That count is the basis for treating a close beyond 61.8% of an individual trending leg as a trend-change signal.
The mechanical rules use weekly closes only. They reverse when any trending move is retraced by more than 61.8% on a weekly close, and they trail a 61.8% retracement as the stop on the new move. A 61.8% violation counts only on a weekly close, not on an intraweek print.
S&P 500 weekly closes, June 2007 to May 2008
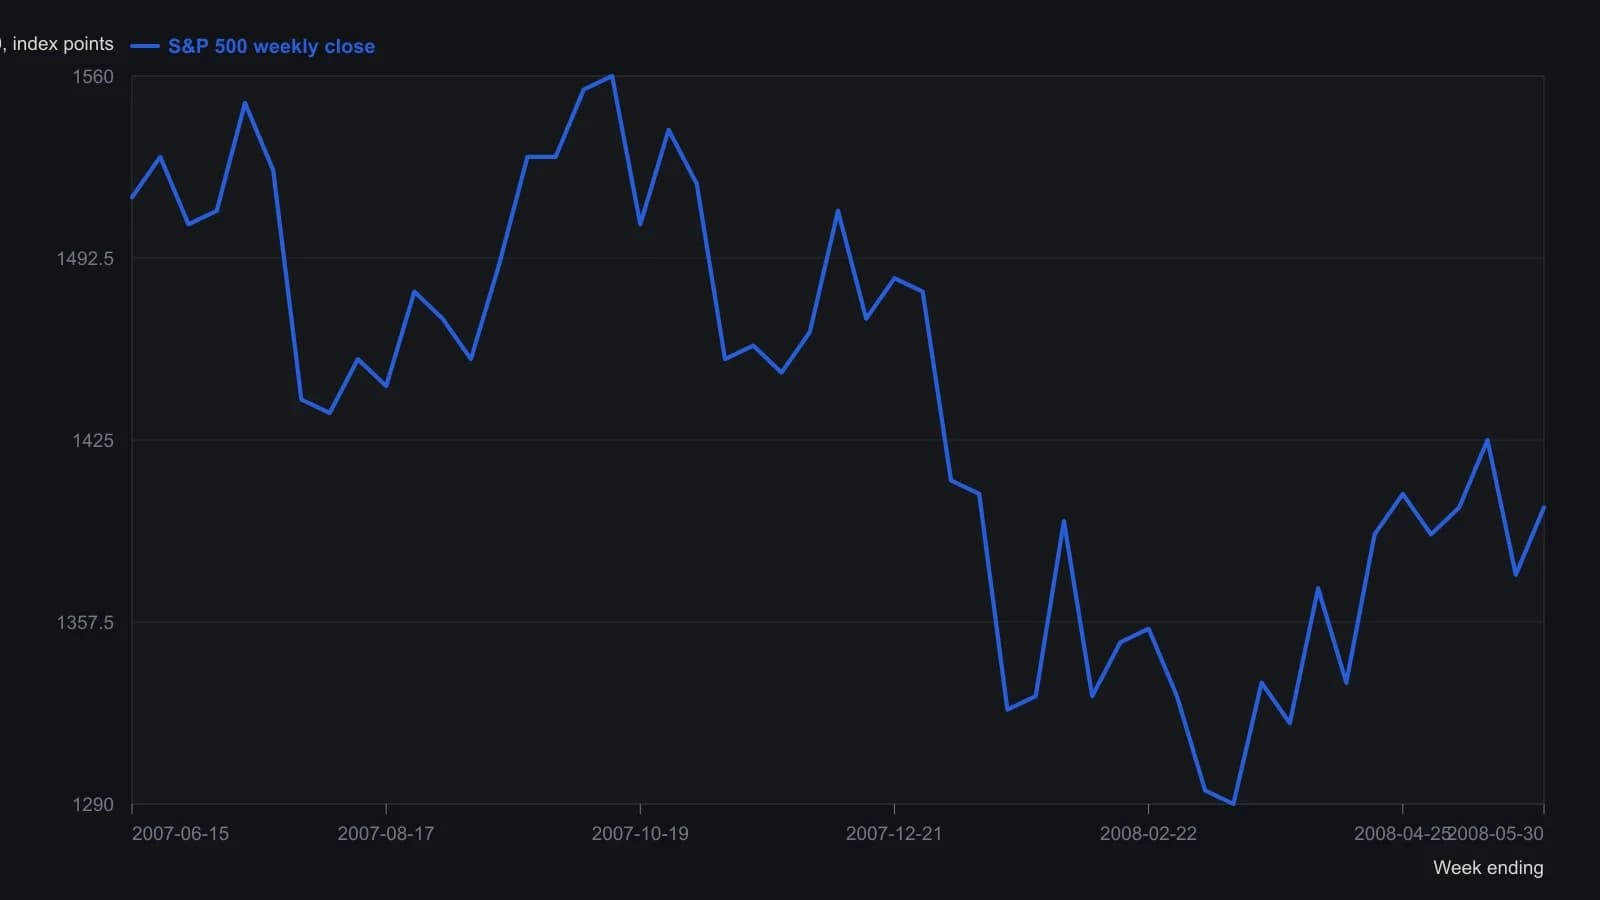
Points are approximate weekly closes digitized from the plotted line and rounded to the nearest five index points. The source study uses weekly closing prices only; the raster does not support tick precision.
Keeping the stop on the whole impulse
In October 2007 a retrace of more than 61.8% of the latest up leg was treated as a short signal. A trailing 61.8% stop was then used until another trending swing was retraced by more than 61.8%.
Downward five-wave structures in late 2007 and early 2008 were treated as evidence that the dominant trend on that chart had turned down. Impulse-wave labeling can keep the stop on 61.8% of an entire five-wave decline rather than exiting at each five-wave completion, which in the 2007 to 2009 illustration left the short in place until that decline ended.
On the advance from the 2009 lows the same trailing 61.8% construction is described as remaining long for nearly the entire run from 800 to 1300, with more false signals during the indecisive 2011 stretch.
All readings on this track · 12 readings
- 2001Impulse-wave subcounts as a case-study filter
- 2006Wave 3 trend exits with pitchforks, channels, and Fibonacci
- 2006Four-leg Fibonacci reversal as an impulse wave checkpoint
- 2010An unfinished fifth wave blocked a second-wave count
- 2010Write the rubber-band long before the fill
- 2011A 5% trail cannot say whether the impulse-correction count is still alive
- 2012Wave counting as context before trade setups
- 2012A weekly-close test of impulse, correction, and the 61.8% stop
- 2013When wave templates fail under momentum override
- 2013Late momentum is a five-wave sentiment trap
- 2019Counting successive impulses after a productivity shock
- 2020Wave counts and Fibonacci targets as a falsifiable trade plan