2013issue C1230-33
Walk-forward filter selection for repeated-median velocity
Walk-forward analysis, an in-sample metric screen, and Robustness testing turn a three-parameter Trend filter into a repeatable keep, discard, or sit-out procedure. Filter choice, not a peak profit row, is what maps each window onto the next out-of-sample week.
- The repeated-median velocity procedure uses three tunable inputs: lookback length N and two signed velocity thresholds that separately gate long and short signals.
- Each of 105 walk-forward windows produced 2400 input combinations, so a reusable filter, not a single peak profit row, maps the in-sample case onto the next out-of-sample week.
- Simple ranking by net profit or profit factor rarely carries valid average profits forward. A stricter screen drops high-activity cases, keeps the 20 rows with the fewest losing bars, then takes the highest remaining in-sample net profit.
- The same in-sample rule can output an abstention week when no qualifying inputs fire, and session bounds are an evaluation choice rather than a given of the velocity rule.
Filter choice is the evaluation object
Editorial reading: Walk-forward analysis is used here to make a Trend filter testable as one procedure. The designer is not naming a permanent lookback. The designer is choosing, in each window, which input row to keep, which rows to discard, and whether the next week should sit out.
The historical workflow applies that reading to a repeated-median velocity rule with three tunable inputs. Robustness testing then asks whether the chosen screen is distinguishable from random filter picks.
Three inputs on one-minute bars
The repeated-median velocity procedure uses three tunable inputs: lookback length N plus two signed velocity thresholds that separately gate long and short signals. Those signed gates are the Trend filter. Long and short are not required to share one velocity cutoff.
Parameter search on one-minute Russell 2000 emini bars spanned N from 20 to 70 in steps of 10 and both velocity thresholds from 0.5 to 10 in steps of 0.5.
Paired windows, not a single peak row
The evaluation used 105 paired windows of 30 in-sample days followed by seven out-of-sample days covering March 30, 2011 through May 3, 2013.
Each window produced 2400 input combinations, so filter choice, not a single peak profit row, is what maps an in-sample case onto the next out-of-sample week. Editorial reading: specifying a screen that can be reused on the next window is a different act from selecting the top profit cell in the current window.
Why net profit ranking is a weak selector
Simple in-sample ranking by net profit or profit factor is treated as a weak selector because it rarely carries valid average profits into the following out-of-sample window.
A stricter screen first drops cases with 80 or more in-sample trades per month, then keeps the 20 remaining rows with the fewest losing bars, then takes the highest in-sample net profit from that shortlist. The profit sort comes last, and only after the activity and losing-bar cuts.
One-row filter versus random picks
Applying that one-row filter to every window yields 105 out-of-sample weeks whose average profit, losing-week streak, equity smoothness, and chance probability can be compared with a bootstrap of random filter picks. That comparison is the Robustness testing step.
On the selected filter, the out-of-sample equity path tracked a second-order polynomial with an R-squared of 0.96 before costs and 0.92 after the 30-unit round-turn cost.
Abstention weeks and session bounds
Weekly activity under the same filter ranged from zero trades to 33 trades, averaging 8.9, so the in-sample rule can also output an abstention week when no qualifying inputs fire.
Restricting execution to 8:30 a.m. through 3:30 p.m. Central time omitted overnight sessions in a 22-hour contract, so session bounds are themselves an evaluation choice, not a given of the velocity rule. Editorial reading: entry, exit, and abstention are not fully specified until those session bounds are stated with the three velocity inputs.
Walk-forward OOS equity, b20tLB<80-tnp filter on TF
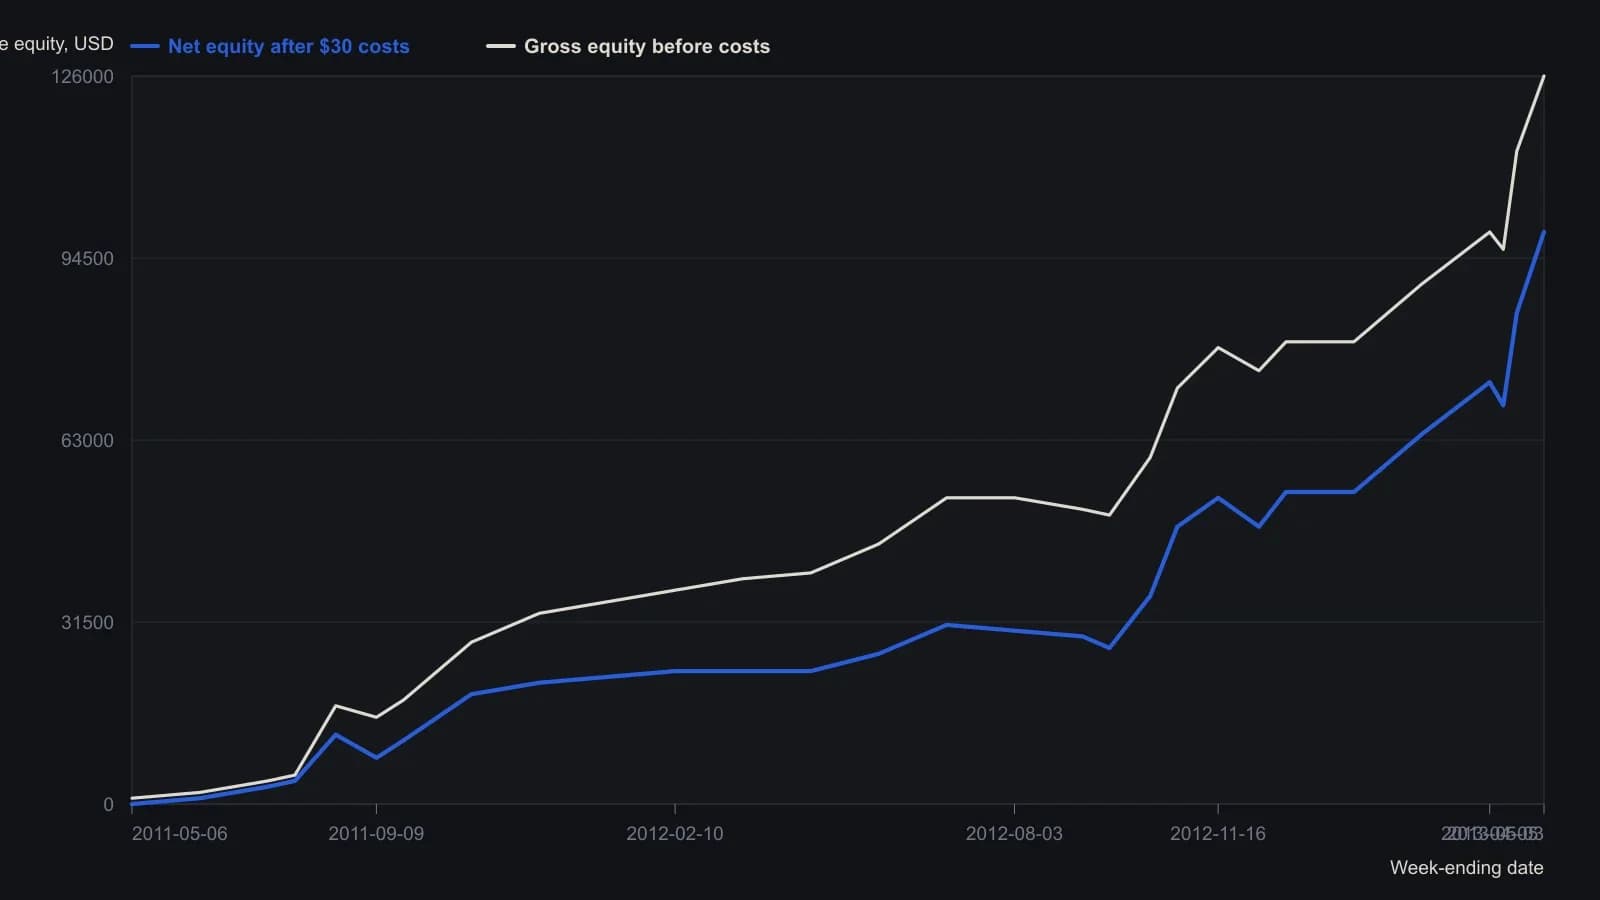
Y-values read from the raster to the nearest $1,000. The test used 105 windows of 30 in-sample days and seven out-of-sample days on TF one-minute bars, with N, vup and vdn re-selected each window and a $30 round-trip cost. Some weeks the filter found no qualifying inputs and the system sat out.
All readings on this track · 51 readings
- 1986Degrees of freedom in trading system optimization
- 1988Walk-forward and neighborhood tests after optimization
- 1988Undisclosed rules block system robustness tests
- 1988Testing re-optimization calendars against random parameter controls
- 1989Binary search limits on multi-peak average grids
- 1989Parameter neighborhoods that survive a shift
- 1990Use profit mapping to keep a cycle and stop plateau
- 1990Why popular indicator optimization fails robustness
- 1991Retesting weighted indicator balances across horizons
- 1992Constructing forecast models with regression, walk-forward, and robustness
- 1992Diagnose regimes before you lock parameters
- 1992When stops change system timing
- 1993Walk-forward halt rules for forecast models
- 1994Walk-forward evaluation of genetic index rules
- 1995Input pruning as walk-forward system evaluation
- 1995Critiquing neural nets as incomplete trading systems
- 1996Rebuild the equity-path ratio before it ranks a designed system
- 1996Parameter grids can fit random walks
- 1996Walk-forward analysis belongs in the design of a mechanical trading system
- 1997When a holdout fails, discard the rule set
- 1997Test rewarded rule breaks before replacing the system
- 1997Walk-forward rules keep system research from rewriting live trades
- 1999Keep a channel-breakout to two lookbacks and test neighbor stability
- 1999Constant investment size in stock system evaluation
- 2000Forcing optimization maps mechanical system failure boundaries
- 2000Robust parameter selection with surface charts
- 2001A two-gate classroom test for a two-window momentum trend filter
- 2002How a two-sided continuation factor becomes a testable trend rule
- 2002Evaluating two-window trend intensity as a reversal rule
- 2003Discounting speculative bubbles in system robustness tests
- 2003Walk-forward evaluation of locked stochastic oscillator rules
- 2003Critiquing mechanical system design after extreme price regimes
- 2004Evaluating a two-window trend trigger
- 2005Grade backtested signals with holdouts and optimization plateaus
- 2006Reserved-sample evaluation of trading system design
- 2006Walk-forward critique of hindsight crossover systems
- 2008Condition-matched walk-forward evaluation for mechanical systems
- 2011Session-split evaluation of regular and overnight systems
- 2012Walk-forward evaluation as operator rehearsal
- 2013Two-window evaluation of mechanical trading systems
- 2013Walk-forward filter selection for repeated-median velocity
- 2014Walk-forward evaluation for fading-memory velocity systems
- 2015Test oscillator events before tuning rules
- 2016Walk-forward evaluation of a five-parameter parabolic stop-and-reversal
- 2016Walk-forward optimization without curve fitting
- 2017Optimization without overfitting in trend-system evaluation
- 2017Parameter stability is a better guide than a larger crossover grid
- 2018Point-in-time universes for system evaluation
- 2018Walk-forward robustness evaluation for optimized systems
- 2018Critiquing breakout systems through robustness tests
- 2018A critique of parameter fitting in system design