1989issue C111-8
Parameter neighborhoods that survive a shift
Parameter choice is framed as finding settings that stay profitable while limiting equity drawdown after an optimal-parameter-shift. Neighborhoods are kept when neighbors support the center and a 10% move in any parameter still passes a profit-to-drawdown-screen.
- Treat parameter choice as finding settings that stay profitable and limit equity drawdown as conditions change, not as maximizing closed cumulative profit.
- Aim for an operating point that can take an optimal-parameter-shift of 25% or more and still avoid an annual loss for any commodity under test.
- Run a wide-scan and then a narrow-scan until a 10% move in any parameter still meets the annual 2.5-to-1 profit-to-drawdown-screen, and prefer the lower peak-to-trough-maximum-equity-drawdown when two neighborhoods score almost the same.
- Keep a sector-central-value only when neighbors support the average-sector-value; discard an equity-spike and recompute the score after removing any single trade that accounts for more than 10% of closed profit.
Settings that stay profitable as conditions change
Parameter choice is framed as finding settings that stay profitable while limiting equity drawdown as conditions change, not as maximizing closed cumulative profit.
Optimal-parameter-shift is the change, from one sample window to the next, in the settings that look best on a completed-trade score. Commodity systems are said to be able to remain profitable for a given market after shifts as large as 50%. The stated search target is an operating point profitable enough that shifts of 25% or more still avoid an annual loss for any commodity under test.
How the completed-trade score is kept
The evaluation protocol uses one-contract trading, 50 to 100 currency units of commission and slippage per closed trade, no entries on locked-limit days, and at least six years of prices.
Open trades are dropped from the score unless they have already exceeded their peak equity. Intra-trade swings are accumulated as peak-to-trough-maximum-equity-drawdown until a new equity high, after which the accumulator resets.
Wide scan and narrow scan
Optimization is described as a wide-scan, then a narrow-scan, continued until a 10% move in any parameter still meets an annual 2.5-to-1 profit-to-drawdown-screen. If two neighborhoods score almost the same on that screen, the lower peak-to-trough-maximum-equity-drawdown is preferred.
Wide scan: closed profit by price-band and moving-average period
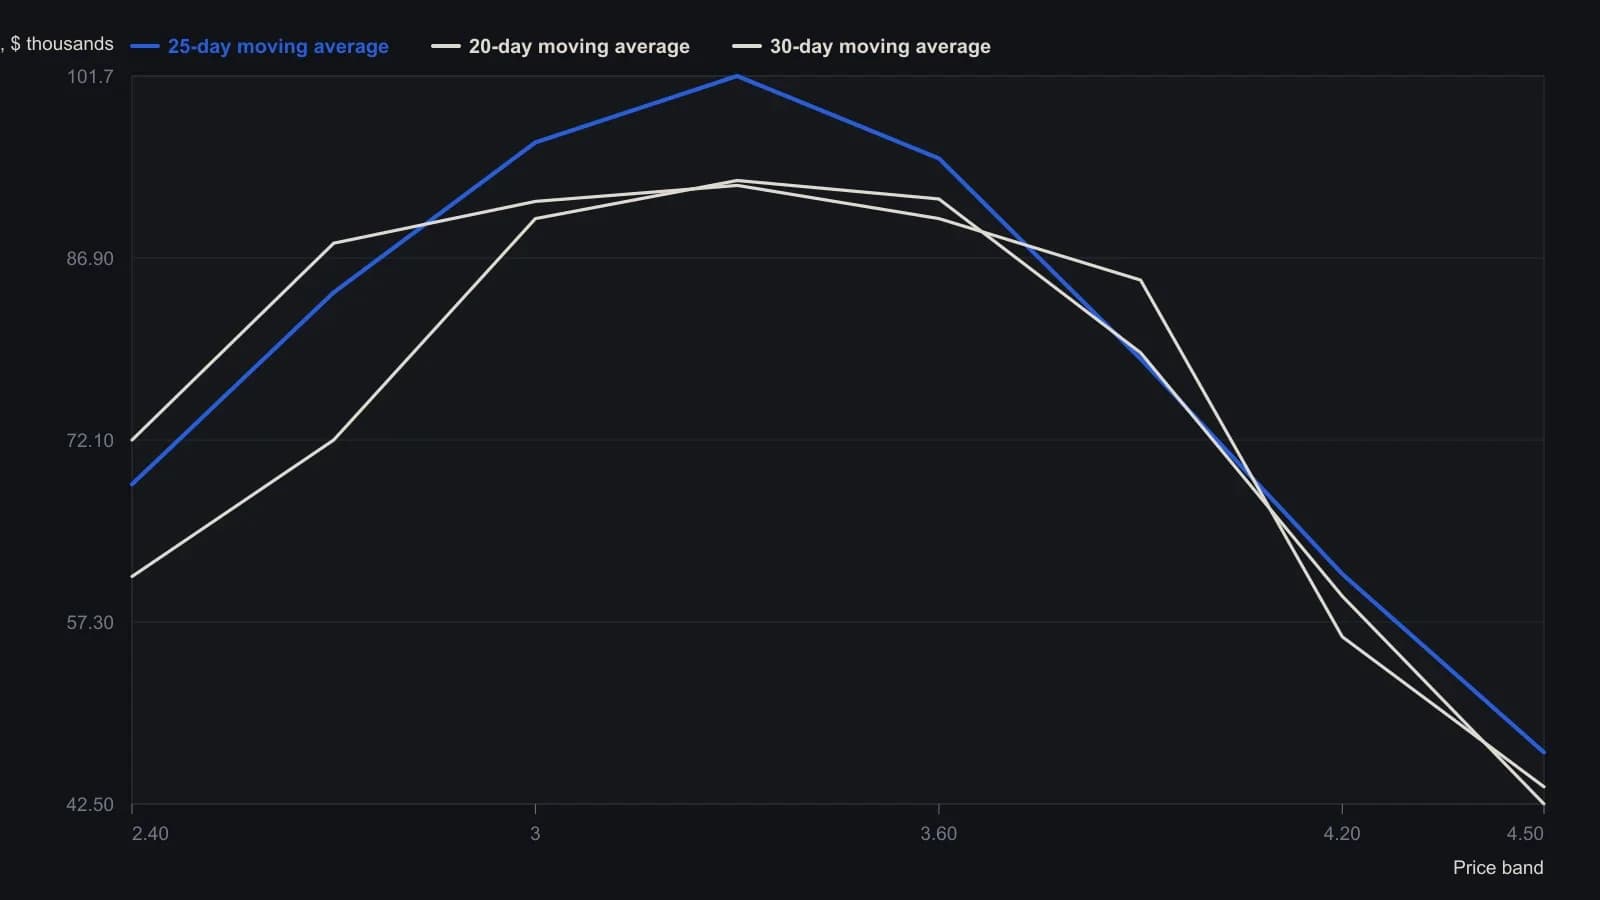
Profits are closed cumulative results in thousands of dollars after $100 commission and slippage per trade, as reported in the wide-scan grid.
Sector values and equity spikes
Average-sector-value is the mean of a nine-cell grid around a candidate center. The sector-central-value is to be used only when neighboring cells keep closed profit from falling sharply.
A candidate center is treated as an equity-spike and not used for trading if it sits 10% or more above any neighbor. A related check is whether more than 10% of closed profit comes from a single trade. If it does, that trade is removed and the score is recomputed.
The moving-average band example
In the moving-average-plus-band example, a close through the upper edge of a percentage-price-band is a buy, a close through the lower edge is a sell, and the moving average is the exit stop. A 10% change in lookback or band width is expected to change closed profit by no more than 10% if the center is robust.
The first-pass moving-average wide-scan covers lookbacks from 5 to 35 days and band widths from 2.4% to 4.5%. Later neighborhood comparisons of drawdown and the profit-to-drawdown-screen are used to pick among several candidate centers rather than taking the single largest closed-profit cell.
All readings on this track · 51 readings
- 1986Degrees of freedom in trading system optimization
- 1988Walk-forward and neighborhood tests after optimization
- 1988Undisclosed rules block system robustness tests
- 1988Testing re-optimization calendars against random parameter controls
- 1989Binary search limits on multi-peak average grids
- 1989Parameter neighborhoods that survive a shift
- 1990Use profit mapping to keep a cycle and stop plateau
- 1990Why popular indicator optimization fails robustness
- 1991Retesting weighted indicator balances across horizons
- 1992Constructing forecast models with regression, walk-forward, and robustness
- 1992Diagnose regimes before you lock parameters
- 1992When stops change system timing
- 1993Walk-forward halt rules for forecast models
- 1994Walk-forward evaluation of genetic index rules
- 1995Input pruning as walk-forward system evaluation
- 1995Critiquing neural nets as incomplete trading systems
- 1996Rebuild the equity-path ratio before it ranks a designed system
- 1996Parameter grids can fit random walks
- 1996Walk-forward analysis belongs in the design of a mechanical trading system
- 1997When a holdout fails, discard the rule set
- 1997Test rewarded rule breaks before replacing the system
- 1997Walk-forward rules keep system research from rewriting live trades
- 1999Keep a channel-breakout to two lookbacks and test neighbor stability
- 1999Constant investment size in stock system evaluation
- 2000Forcing optimization maps mechanical system failure boundaries
- 2000Robust parameter selection with surface charts
- 2001A two-gate classroom test for a two-window momentum trend filter
- 2002How a two-sided continuation factor becomes a testable trend rule
- 2002Evaluating two-window trend intensity as a reversal rule
- 2003Discounting speculative bubbles in system robustness tests
- 2003Walk-forward evaluation of locked stochastic oscillator rules
- 2003Critiquing mechanical system design after extreme price regimes
- 2004Evaluating a two-window trend trigger
- 2005Grade backtested signals with holdouts and optimization plateaus
- 2006Reserved-sample evaluation of trading system design
- 2006Walk-forward critique of hindsight crossover systems
- 2008Condition-matched walk-forward evaluation for mechanical systems
- 2011Session-split evaluation of regular and overnight systems
- 2012Walk-forward evaluation as operator rehearsal
- 2013Two-window evaluation of mechanical trading systems
- 2013Walk-forward filter selection for repeated-median velocity
- 2014Walk-forward evaluation for fading-memory velocity systems
- 2015Test oscillator events before tuning rules
- 2016Walk-forward evaluation of a five-parameter parabolic stop-and-reversal
- 2016Walk-forward optimization without curve fitting
- 2017Optimization without overfitting in trend-system evaluation
- 2017Parameter stability is a better guide than a larger crossover grid
- 2018Point-in-time universes for system evaluation
- 2018Walk-forward robustness evaluation for optimized systems
- 2018Critiquing breakout systems through robustness tests
- 2018A critique of parameter fitting in system design