1988issue C041-7
Walk-forward and neighborhood tests after optimization
System-optimization can still report a profitable combination when the series is random or the indicator has no skill. Editorial view: treat the in-sample peak as a proposal, and treat the joint procedure as a candidate only after unused-window scoring and neighborhood robustness-testing agree it is not a one-point fit.
- System-optimization can still report a profitable combination when the series is random or the indicator has no skill, so the in-sample peak does not by itself show that the procedure will remain reliable.
- Walk-forward-analysis optimizes on one window and evaluates the same rules on a later unused window, so those later results are not produced by hindsight.
- A profit-distribution-chart and cluster-spotting ask whether profits stay orderly around the peak; an isolated spike is a weaker robustness-testing signal than a neighborhood of similar profits.
- Repeatedly trying procedures until one looks good on the unused window is second-order-optimization and can still fit chance.
Optimization proposes a joint procedure
System-optimization is a search over rule inputs that picks the historically strongest joint entry, exit, and abstention procedure. A search for the highest historical profit can still report a profitable combination when the series is random or the indicator has no skill. The in-sample peak does not by itself show that the procedure will remain reliable.
A mechanical procedure assumes both a recurring price pattern and an indicator that can exploit it. If the pattern is too infrequent, or the indicator also fires on similar but unwanted setups, losing trades can outnumber winning ones.
Score the same rules on a later unused window
Walk-forward-analysis fits the procedure on one window, then scores the same rules on a later window that was not used in fitting. The later results are not produced by hindsight.
The method needs enough history to both fit and retest. When possible the illustrated design used at least five to 10 years. A shorter fit window can be chosen so that more years remain for unused-window tests.
An illustrated rolling and expanding design
One illustrated walk-forward design on T-bond futures used 40 expired contracts over 10 years. It traded the last three months of each contract, optimized on 12 contracts covering three years, tested the next contract, then rolled that window through contract 40, producing a seven-year unused-window record on 28 contracts.
An expanding-window variant adds each new contract to the optimization sample instead of dropping the oldest. That variant can suit longer-horizon systems that need more history in every fit.
Second-order-optimization can still fit chance
Repeatedly trying procedures until one looks good on the unused window is second-order-optimization and can still fit chance. The expanding design also re-optimizes early contracts many times, up to 28 times for contracts 1 through 12.
Judge nearby profits, not only the peak
Robustness-testing asks whether profits stay orderly across nearby parameter values instead of appearing only at the single best fit.
A profit-distribution-chart plots profit against one varied parameter. A smooth rise and fall around a peak is treated as a sign that the parameter influences results, while sharp irregular spikes are treated as a sign of little consistent effect. The chart can change only one parameter at a time, so it isolates inputs better than it certifies a multi-parameter system. Reading the shape is a judgment used mainly to reject obviously unstable settings.
Cluster-spotting inspects results around the best system-optimization point. A peak whose neighboring parameter sets show similar profits is treated as a stronger robustness-testing signal than an isolated spike.
Profit versus RSI lookback length
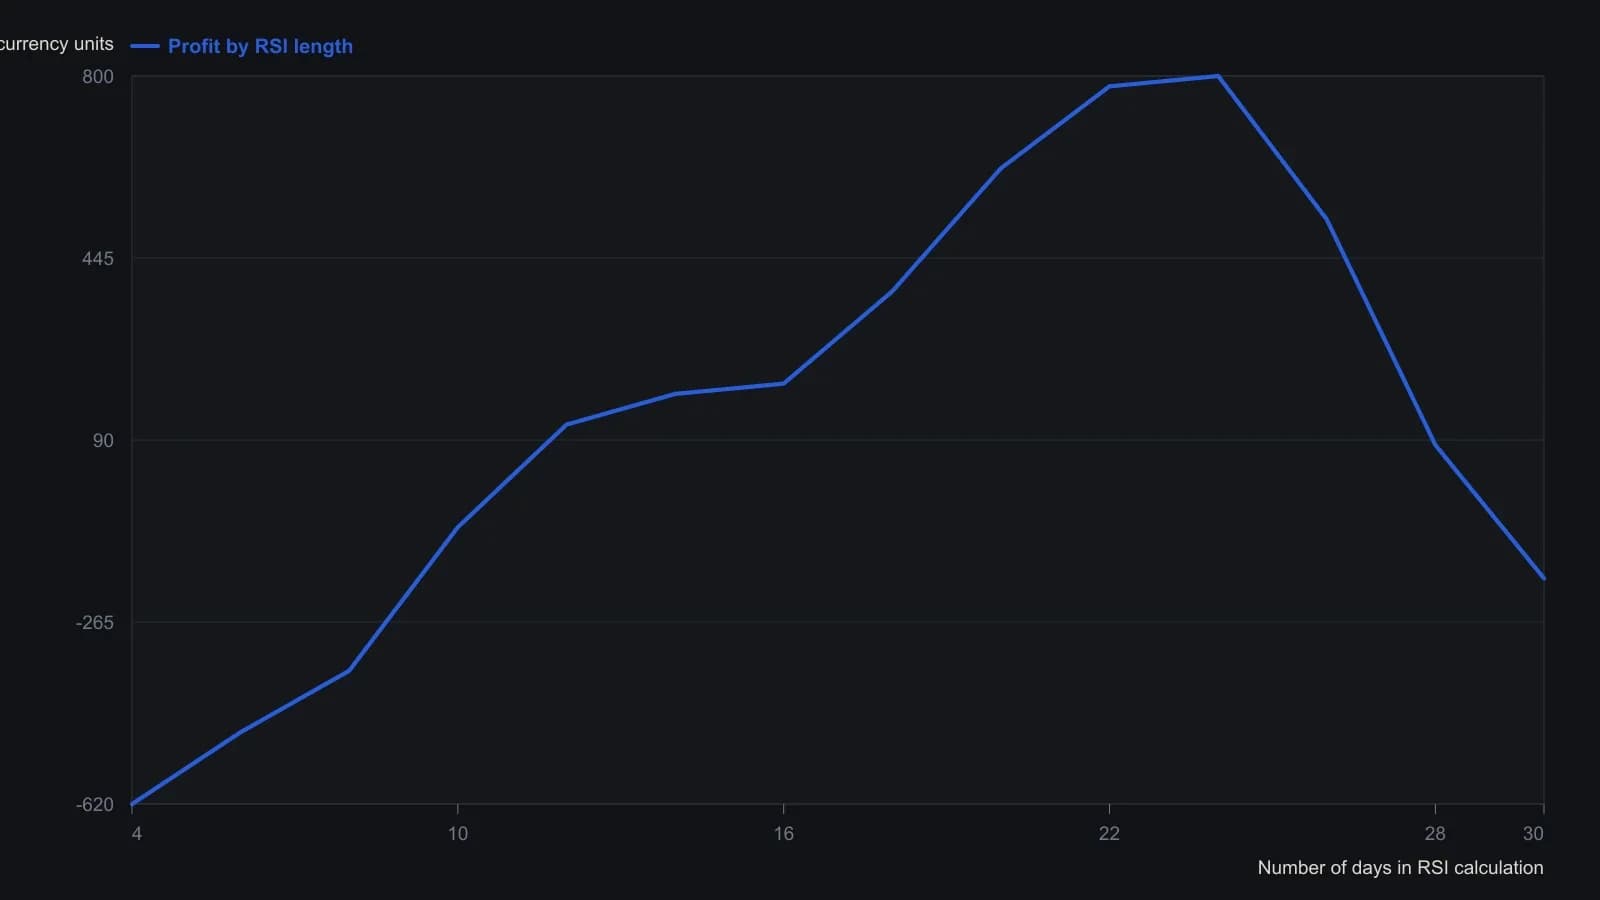
The source plots a single-parameter sweep of RSI length only; nearby points are approximate readings from the printed curve. The article states the peak at 22 days.
All readings on this track · 51 readings
- 1986Degrees of freedom in trading system optimization
- 1988Walk-forward and neighborhood tests after optimization
- 1988Undisclosed rules block system robustness tests
- 1988Testing re-optimization calendars against random parameter controls
- 1989Binary search limits on multi-peak average grids
- 1989Parameter neighborhoods that survive a shift
- 1990Use profit mapping to keep a cycle and stop plateau
- 1990Why popular indicator optimization fails robustness
- 1991Retesting weighted indicator balances across horizons
- 1992Constructing forecast models with regression, walk-forward, and robustness
- 1992Diagnose regimes before you lock parameters
- 1992When stops change system timing
- 1993Walk-forward halt rules for forecast models
- 1994Walk-forward evaluation of genetic index rules
- 1995Input pruning as walk-forward system evaluation
- 1995Critiquing neural nets as incomplete trading systems
- 1996Rebuild the equity-path ratio before it ranks a designed system
- 1996Parameter grids can fit random walks
- 1996Walk-forward analysis belongs in the design of a mechanical trading system
- 1997When a holdout fails, discard the rule set
- 1997Test rewarded rule breaks before replacing the system
- 1997Walk-forward rules keep system research from rewriting live trades
- 1999Keep a channel-breakout to two lookbacks and test neighbor stability
- 1999Constant investment size in stock system evaluation
- 2000Forcing optimization maps mechanical system failure boundaries
- 2000Robust parameter selection with surface charts
- 2001A two-gate classroom test for a two-window momentum trend filter
- 2002How a two-sided continuation factor becomes a testable trend rule
- 2002Evaluating two-window trend intensity as a reversal rule
- 2003Discounting speculative bubbles in system robustness tests
- 2003Walk-forward evaluation of locked stochastic oscillator rules
- 2003Critiquing mechanical system design after extreme price regimes
- 2004Evaluating a two-window trend trigger
- 2005Grade backtested signals with holdouts and optimization plateaus
- 2006Reserved-sample evaluation of trading system design
- 2006Walk-forward critique of hindsight crossover systems
- 2008Condition-matched walk-forward evaluation for mechanical systems
- 2011Session-split evaluation of regular and overnight systems
- 2012Walk-forward evaluation as operator rehearsal
- 2013Two-window evaluation of mechanical trading systems
- 2013Walk-forward filter selection for repeated-median velocity
- 2014Walk-forward evaluation for fading-memory velocity systems
- 2015Test oscillator events before tuning rules
- 2016Walk-forward evaluation of a five-parameter parabolic stop-and-reversal
- 2016Walk-forward optimization without curve fitting
- 2017Optimization without overfitting in trend-system evaluation
- 2017Parameter stability is a better guide than a larger crossover grid
- 2018Point-in-time universes for system evaluation
- 2018Walk-forward robustness evaluation for optimized systems
- 2018Critiquing breakout systems through robustness tests
- 2018A critique of parameter fitting in system design