2002issue C061-4
Evaluating two-window trend intensity as a reversal rule
A 30-period trend intensity index scores recent up-deviation mass against a 60-period average of closes. The historical workflow made that reading testable by locking next-open reversal rules, one shared lookback, and the same 80/20 thresholds, then repeating the procedure in a lookback sweep.
- The trend intensity index is a 0 to 100 share of recent up-deviation mass among all close-to-average deviations over the shorter window.
- The mechanical procedure became a reversal engine only after a reading above 80 or below 20 set a long or short stance at the next open and that stance was held until the opposite threshold was crossed.
- The same lookback and the same 80/20 thresholds were applied to fifteen continuous-contract futures series, so the intensity window was not chosen market by market.
- Robustness testing held the entry, hold, reverse, and portfolio rules fixed and repeated the procedure at intensity windows of 20, 25, 30, 35, and 40 periods.
What the two-window reading measures
The trend intensity index is built from a two-window construction. A 60-period simple average of closes sets the reference level. Each of the last 30 closes is then compared with that average. Residuals above the average are up-deviations. Residuals below it are down-deviations. The index is the up-deviation sum divided by the combined up and down sums, then scaled by 100.
The index is bounded between 0 and 100. A reading above the intensity midpoint of 50 means recent up-deviation mass exceeds down-deviation mass. A reading below 50 means the opposite. Trend intensity is the distance from that midpoint toward 100 or toward 0.
Why the two windows are paired
The construction rationale is that, in a persistent rise spanning the longer average window, most closes in the recent half of that window should sit above the average, so the up-share of deviations should exceed one half. The opposite pattern is expected in a persistent decline.
How the reversal procedure is locked
The mechanical procedure treated the index as a reversal engine. It went long the next open after a reading above 80, went short the next open after a reading below 20, and kept the existing stance until the opposite threshold was crossed. Next-open execution takes the stance implied by today’s completed reading at the following session’s open.
How a spreadsheet implements the same rules
A spreadsheet implementation first forms the 60-period average, then the 30-period sum of absolute close-to-average deviations, the signed 30-period residual sum, the implied up-deviation sum, and the percentage index. The position cell becomes 1, -1, or the prior stance according to the 80/20 thresholds. A new fill is taken at the next open only when that stance changes.
Yen 30-day TII, late December 1998
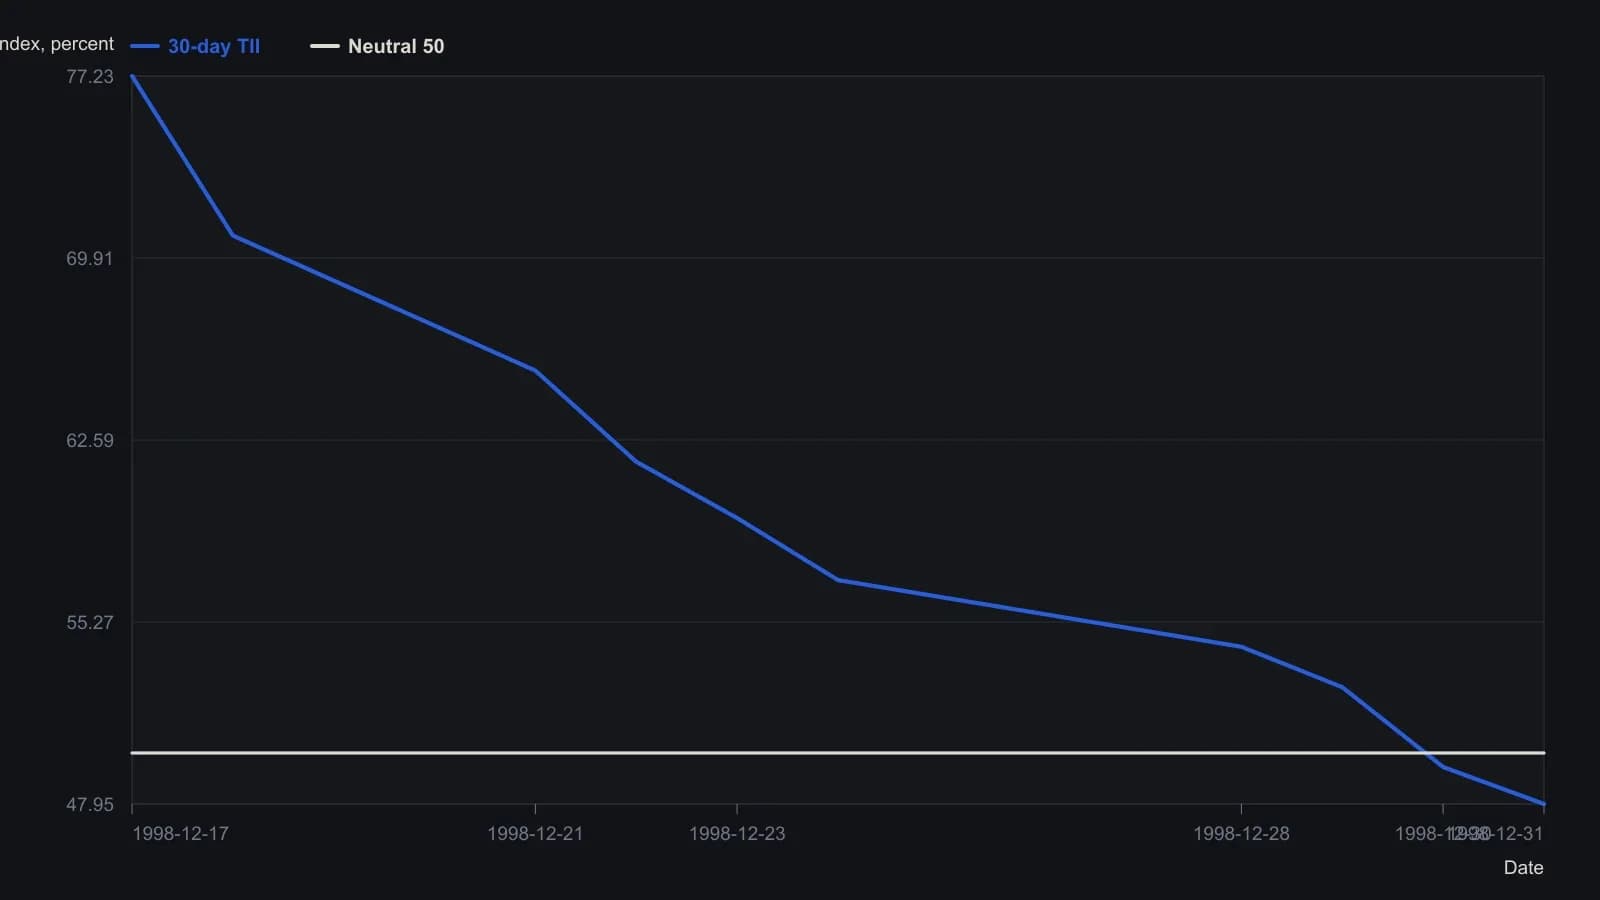
Sidebar uses continuous-contract yen from 23 September through 31 December 1998; TII is defined only from the first complete 60-day average (row 61). Same 80/20 next-open lock as the 15-market test.
What stayed fixed across the sample
The historical procedure applied the same lookback and the same 80/20 thresholds to fifteen futures series. It used a continuous-contract sample, allowed one contract per entry, deducted 75 currency units per trade for costs, and ran from 4 January 1982 through 31 December 1998. Any stance still open on the final sample date was closed at that session’s close rather than left unmarked.
How the lookback sweep tests robustness
Robustness was examined by holding the entry, hold, reverse, and portfolio rules fixed and repeating the test at intensity windows of 20, 25, 30, 35, and 40 periods instead of choosing a separate length for each market. The lookback sweep therefore changes only the shorter intensity window while the reversal procedure stays the same.
All readings on this track · 51 readings
- 1986Degrees of freedom in trading system optimization
- 1988Walk-forward and neighborhood tests after optimization
- 1988Undisclosed rules block system robustness tests
- 1988Testing re-optimization calendars against random parameter controls
- 1989Binary search limits on multi-peak average grids
- 1989Parameter neighborhoods that survive a shift
- 1990Use profit mapping to keep a cycle and stop plateau
- 1990Why popular indicator optimization fails robustness
- 1991Retesting weighted indicator balances across horizons
- 1992Constructing forecast models with regression, walk-forward, and robustness
- 1992Diagnose regimes before you lock parameters
- 1992When stops change system timing
- 1993Walk-forward halt rules for forecast models
- 1994Walk-forward evaluation of genetic index rules
- 1995Input pruning as walk-forward system evaluation
- 1995Critiquing neural nets as incomplete trading systems
- 1996Rebuild the equity-path ratio before it ranks a designed system
- 1996Parameter grids can fit random walks
- 1996Walk-forward analysis belongs in the design of a mechanical trading system
- 1997When a holdout fails, discard the rule set
- 1997Test rewarded rule breaks before replacing the system
- 1997Walk-forward rules keep system research from rewriting live trades
- 1999Keep a channel-breakout to two lookbacks and test neighbor stability
- 1999Constant investment size in stock system evaluation
- 2000Forcing optimization maps mechanical system failure boundaries
- 2000Robust parameter selection with surface charts
- 2001A two-gate classroom test for a two-window momentum trend filter
- 2002How a two-sided continuation factor becomes a testable trend rule
- 2002Evaluating two-window trend intensity as a reversal rule
- 2003Discounting speculative bubbles in system robustness tests
- 2003Walk-forward evaluation of locked stochastic oscillator rules
- 2003Critiquing mechanical system design after extreme price regimes
- 2004Evaluating a two-window trend trigger
- 2005Grade backtested signals with holdouts and optimization plateaus
- 2006Reserved-sample evaluation of trading system design
- 2006Walk-forward critique of hindsight crossover systems
- 2008Condition-matched walk-forward evaluation for mechanical systems
- 2011Session-split evaluation of regular and overnight systems
- 2012Walk-forward evaluation as operator rehearsal
- 2013Two-window evaluation of mechanical trading systems
- 2013Walk-forward filter selection for repeated-median velocity
- 2014Walk-forward evaluation for fading-memory velocity systems
- 2015Test oscillator events before tuning rules
- 2016Walk-forward evaluation of a five-parameter parabolic stop-and-reversal
- 2016Walk-forward optimization without curve fitting
- 2017Optimization without overfitting in trend-system evaluation
- 2017Parameter stability is a better guide than a larger crossover grid
- 2018Point-in-time universes for system evaluation
- 2018Walk-forward robustness evaluation for optimized systems
- 2018Critiquing breakout systems through robustness tests
- 2018A critique of parameter fitting in system design