2017issue C0946-47
Parameter stability is a better guide than a larger crossover grid
Across the windows labeled 1985, 2000, and 2008, the average of all moving-average-crossover tests is described as similar to the average of all single-trend tests, so the remaining decision is which trade-profile to accept. Editorial reading: keep the design whose already-reasonable parameter-neighborhood still works in every accepted window, and treat a slowly changing crossover surface as a warning.
- When the average of all moving-average-crossover tests looks similar to the average of all single-trend tests, the remaining decision is which trade-profile to accept.
- Robustness-testing asks whether three already-reasonable parameters stay usable across every evaluation window you accept as valid.
- Selecting three parameters is easier from a 17-test single-trend test-grid than from a 119-test crossover grid, and adding more parameters complicates the solution.
- Averaging the full test-grid sets realistic expectations. Picking a short-term lookback of 30 or 35 days after scanning the larger crossover grid is questioned as a possible overfitting step.
Similar averages leave a trade-profile choice
Across three historical windows labeled 1985, 2000, and 2008, the average of all moving-average-crossover tests is described as similar to the average of all single-trend tests. That leaves the remaining decision as which trade-profile to accept.
The single-trend profile is characterized as holding positions longer. The moving-average-crossover profile is characterized as generating more trades with smaller typical gains and smaller typical losses.
Profit-taking is described as more compatible with the higher-frequency crossover profile than with the longer-hold single-trend profile. Applying it is said to change the system profile.
Average one-trend vs crossover results by test window
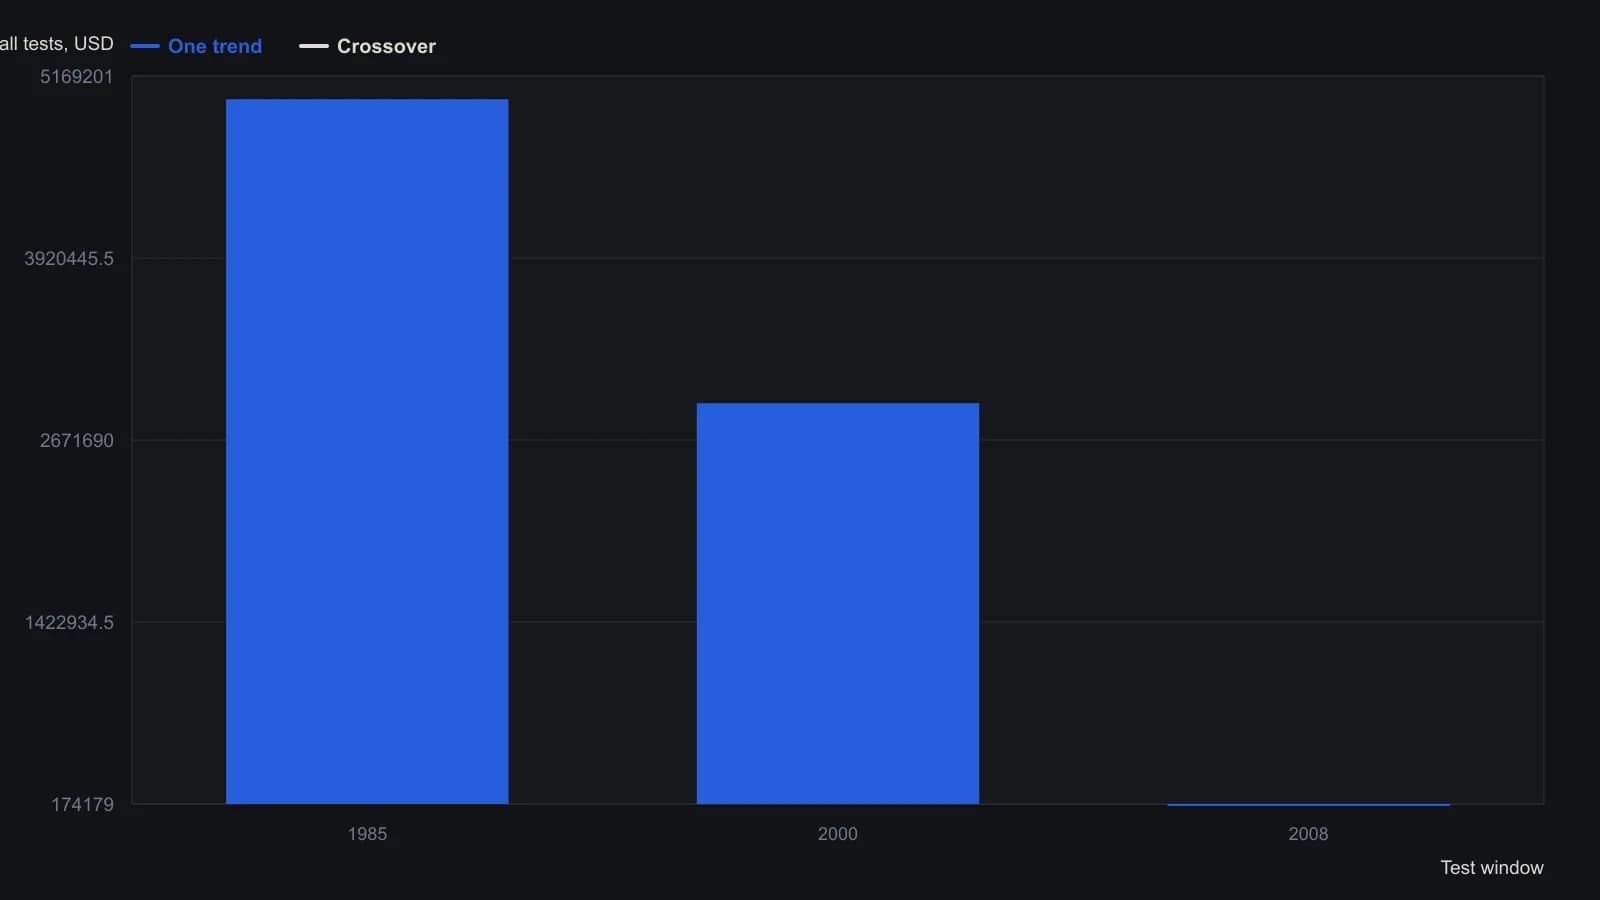
Each cell is the average of all tests in that window, not the single best parameter set. The author notes losses in the 2008 heat map and stays with the single-trend design because a small already-reasonable neighborhood still worked in every window.
Read the full test-grid, not the best cell
System-optimization is presented as a visual evaluation tool for judging whether results are robust or erratic, comparing averages across systems and periods, and detecting whether a design is holding up or degrading.
Averaging all tests is presented as a way to form realistic expectations, in contrast to selecting the single best combination from a large battery of tests.
Three parameters should stay usable in every window
A robustness-testing check offered in the material is whether three parameters remain usable across all evaluation windows. The single-trend design is described as meeting that test, while the crossover design is described as slowly changing.
Selecting three parameters is described as easier from a 17-test single-trend test-grid than from a 119-test crossover test-grid. Adding more parameters is framed as complicating the solution and inviting overfitting.
Choosing a short-term lookback of 30 or 35 days after inspecting the larger crossover grid is explicitly questioned as a possible overfitting step.
All readings on this track · 51 readings
- 1986Degrees of freedom in trading system optimization
- 1988Walk-forward and neighborhood tests after optimization
- 1988Undisclosed rules block system robustness tests
- 1988Testing re-optimization calendars against random parameter controls
- 1989Binary search limits on multi-peak average grids
- 1989Parameter neighborhoods that survive a shift
- 1990Use profit mapping to keep a cycle and stop plateau
- 1990Why popular indicator optimization fails robustness
- 1991Retesting weighted indicator balances across horizons
- 1992Constructing forecast models with regression, walk-forward, and robustness
- 1992Diagnose regimes before you lock parameters
- 1992When stops change system timing
- 1993Walk-forward halt rules for forecast models
- 1994Walk-forward evaluation of genetic index rules
- 1995Input pruning as walk-forward system evaluation
- 1995Critiquing neural nets as incomplete trading systems
- 1996Rebuild the equity-path ratio before it ranks a designed system
- 1996Parameter grids can fit random walks
- 1996Walk-forward analysis belongs in the design of a mechanical trading system
- 1997When a holdout fails, discard the rule set
- 1997Test rewarded rule breaks before replacing the system
- 1997Walk-forward rules keep system research from rewriting live trades
- 1999Keep a channel-breakout to two lookbacks and test neighbor stability
- 1999Constant investment size in stock system evaluation
- 2000Forcing optimization maps mechanical system failure boundaries
- 2000Robust parameter selection with surface charts
- 2001A two-gate classroom test for a two-window momentum trend filter
- 2002How a two-sided continuation factor becomes a testable trend rule
- 2002Evaluating two-window trend intensity as a reversal rule
- 2003Discounting speculative bubbles in system robustness tests
- 2003Walk-forward evaluation of locked stochastic oscillator rules
- 2003Critiquing mechanical system design after extreme price regimes
- 2004Evaluating a two-window trend trigger
- 2005Grade backtested signals with holdouts and optimization plateaus
- 2006Reserved-sample evaluation of trading system design
- 2006Walk-forward critique of hindsight crossover systems
- 2008Condition-matched walk-forward evaluation for mechanical systems
- 2011Session-split evaluation of regular and overnight systems
- 2012Walk-forward evaluation as operator rehearsal
- 2013Two-window evaluation of mechanical trading systems
- 2013Walk-forward filter selection for repeated-median velocity
- 2014Walk-forward evaluation for fading-memory velocity systems
- 2015Test oscillator events before tuning rules
- 2016Walk-forward evaluation of a five-parameter parabolic stop-and-reversal
- 2016Walk-forward optimization without curve fitting
- 2017Optimization without overfitting in trend-system evaluation
- 2017Parameter stability is a better guide than a larger crossover grid
- 2018Point-in-time universes for system evaluation
- 2018Walk-forward robustness evaluation for optimized systems
- 2018Critiquing breakout systems through robustness tests
- 2018A critique of parameter fitting in system design