1999issue C051-4
Constant investment size in stock system evaluation
An equal-share fill can make a stock system's score follow the price level of a split-adjusted series instead of the percent move the rules captured. Treating constant investment size as an execution constraint inside walk-forward analysis, robustness testing, and system optimization keeps the score on entry, exit, and abstention logic.
- Equal share counts on a two-dollar name and a hundred-dollar name make a one-dollar move post the same dollar result even though the percent moves differ by a factor of fifty.
- Setting share count to a one-thousand-dollar stake divided by price makes a fifty-percent move post the same dollar result at two-dollar, twenty-dollar, and hundred-dollar prints.
- Using a split-adjusted print in the constant-stake share formula overstates share count by the split ratio and understates the price change by the same ratio, so the dollar result is unchanged.
- Stock-system tests should keep split-adjusted prices and replace the implicit constant-share fill with a constant investment size so the evaluated procedure matches how the signals would be sized in use.
The fill rule belongs in the procedure
Walk-forward analysis is the out-of-sample scoring of entry, exit, and abstention rules as one procedure, using rule inputs, market state, and execution constraints such as how large each fill is. System optimization is a search over rule inputs inside a test protocol. The size rule is an execution constraint that belongs inside that protocol.
Robustness testing checks whether an evaluated signal still stands when a test assumption changes, including whether share count is held fixed while prices span a wide range. An equal-share fill gives every signal the same number of shares regardless of the name's price or the date in the sample. Constant investment size keeps the dollar stake of each signal fixed, so share count equals that stake divided by the price in force at the signal.
Equal-share fills create a price-level artifact
Equal share counts on a two-dollar name and a hundred-dollar name make a one-dollar move post the same dollar result even though the percent moves differ by a factor of fifty. The same percent move under equal share counts produces a dollar result fifty times larger in the hundred-dollar name than in the two-dollar name.
That gap is a price-level artifact: a test result driven by where the sample sits in price, not by the percent move the rule captured.
Constant investment size holds the stake fixed
Setting share count to a one-thousand-dollar stake divided by price makes a fifty-percent move post the same dollar result at two-dollar, twenty-dollar, and hundred-dollar prints. The score then follows the percent move the signal captured rather than the print level of the name.
Split-adjusted prints and the share formula
A split-adjusted series is a price history scaled by later split ratios so the series does not drop by the split factor on the split date. A split-adjusted print equals the actual print divided by the cumulative split ratio. Two later two-for-one splits turn a twenty-dollar actual print into a five-dollar adjusted print.
Using the adjusted print in the constant-stake share formula overstates share count by the split ratio and understates the price change by the same ratio, so the product that is dollar result is unchanged.
The four-to-one split case
In the worked four-to-one split case, a twenty-percent rise produces a two-hundred-dollar result from actual past prices, adjusted past prices, and the later forty-dollar print when the stake is held at one thousand dollars.
A long-history crossover sample
On a long-history twelve-and-one-hundred-twenty-bar crossover, constant-share scoring treats an early low-price winner as a small per-share gain while constant-dollar scoring keeps the large percent gain visible. Constant-share scoring on split-adjusted history underweights early low-price years and overweights later high-price years, so the same later trade can dominate the total under one size rule and not the other.
Walmart daily price, July 1994 to October 1997
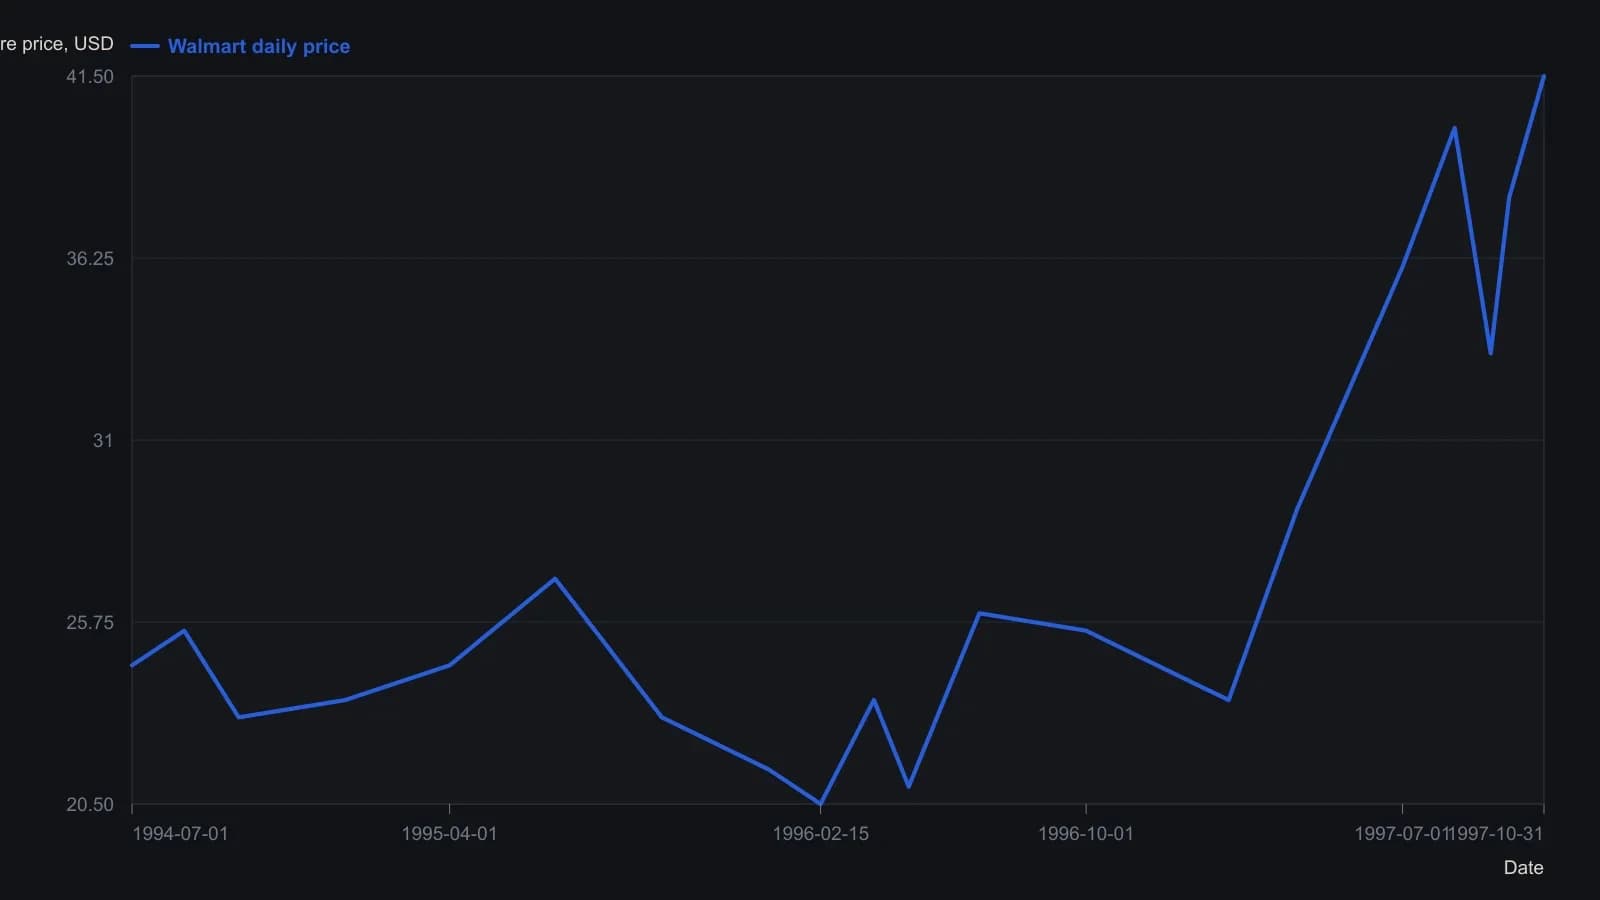
Sampled at labeled months and visible turning points and rounded to the nearest half-dollar; the raster is a daily series and does not support tick-level precision.
What the test should keep
Stock-system tests should keep split-adjusted prices and replace the implicit constant-share fill with a constant investment size so the evaluated procedure matches how the signals would be sized in use.
All readings on this track · 51 readings
- 1986Degrees of freedom in trading system optimization
- 1988Walk-forward and neighborhood tests after optimization
- 1988Undisclosed rules block system robustness tests
- 1988Testing re-optimization calendars against random parameter controls
- 1989Binary search limits on multi-peak average grids
- 1989Parameter neighborhoods that survive a shift
- 1990Use profit mapping to keep a cycle and stop plateau
- 1990Why popular indicator optimization fails robustness
- 1991Retesting weighted indicator balances across horizons
- 1992Constructing forecast models with regression, walk-forward, and robustness
- 1992Diagnose regimes before you lock parameters
- 1992When stops change system timing
- 1993Walk-forward halt rules for forecast models
- 1994Walk-forward evaluation of genetic index rules
- 1995Input pruning as walk-forward system evaluation
- 1995Critiquing neural nets as incomplete trading systems
- 1996Rebuild the equity-path ratio before it ranks a designed system
- 1996Parameter grids can fit random walks
- 1996Walk-forward analysis belongs in the design of a mechanical trading system
- 1997When a holdout fails, discard the rule set
- 1997Test rewarded rule breaks before replacing the system
- 1997Walk-forward rules keep system research from rewriting live trades
- 1999Keep a channel-breakout to two lookbacks and test neighbor stability
- 1999Constant investment size in stock system evaluation
- 2000Forcing optimization maps mechanical system failure boundaries
- 2000Robust parameter selection with surface charts
- 2001A two-gate classroom test for a two-window momentum trend filter
- 2002How a two-sided continuation factor becomes a testable trend rule
- 2002Evaluating two-window trend intensity as a reversal rule
- 2003Discounting speculative bubbles in system robustness tests
- 2003Walk-forward evaluation of locked stochastic oscillator rules
- 2003Critiquing mechanical system design after extreme price regimes
- 2004Evaluating a two-window trend trigger
- 2005Grade backtested signals with holdouts and optimization plateaus
- 2006Reserved-sample evaluation of trading system design
- 2006Walk-forward critique of hindsight crossover systems
- 2008Condition-matched walk-forward evaluation for mechanical systems
- 2011Session-split evaluation of regular and overnight systems
- 2012Walk-forward evaluation as operator rehearsal
- 2013Two-window evaluation of mechanical trading systems
- 2013Walk-forward filter selection for repeated-median velocity
- 2014Walk-forward evaluation for fading-memory velocity systems
- 2015Test oscillator events before tuning rules
- 2016Walk-forward evaluation of a five-parameter parabolic stop-and-reversal
- 2016Walk-forward optimization without curve fitting
- 2017Optimization without overfitting in trend-system evaluation
- 2017Parameter stability is a better guide than a larger crossover grid
- 2018Point-in-time universes for system evaluation
- 2018Walk-forward robustness evaluation for optimized systems
- 2018Critiquing breakout systems through robustness tests
- 2018A critique of parameter fitting in system design