2000issue C041-6
Robust parameter selection with surface charts
Long-history tests, walk-forward holdouts, and visual inspection of a three-dimensional profit surface are complementary ways to judge whether parameter sets stay useful when conditions shift. Wide high plateaus, not sharp peaks, are the neighborhoods to keep.
- Long-history tests, walk-forward holdouts, and visual inspection of a three-dimensional profit surface are complementary ways to judge whether parameter sets stay useful when conditions shift.
- A walk-forward, or blind, procedure optimizes on earlier history, then applies the chosen parameters to unused later data so the final check is run without hindsight.
- On the profit surface, wide high plateaus mark stable neighborhoods, while sharp peaks are treated as fragile and valleys as losing regions.
- The most profitable in-sample parameters are not automatically the ones most likely to remain useful out of sample.
Complementary checks when conditions shift
Long-history tests, walk-forward holdouts, and visual inspection of a three-dimensional profit surface are presented as complementary ways to judge whether parameter sets stay useful when conditions shift.
Robustness testing, system optimization, and walk-forward analysis belong in that same evaluation sequence. The surface maps ending results across parameter combinations. Neighborhood stability is read from that map before a setting is sent into unused later data.
How walk-forward analysis holds out later data
A walk-forward, or blind, procedure optimizes on earlier history, then applies the chosen parameters to unused later data so the final check is run without hindsight.
The holdout window is not available when the setting is chosen. That separation is what makes the later check a test of usefulness after conditions can shift, rather than another pass over the same history.
How to read the profit surface
On the profit surface, each tile is the ending result of one parameter combination. Wide high plateaus mark stable neighborhoods, while sharp peaks are treated as fragile and valleys as losing regions.
A plateau says nearby combinations produce similar endings, so a small move in an input does not drop the design into a valley. A sharp peak is a single high tile with weaker neighbors, so it is treated as a fragile choice.
The most profitable in-sample parameters are not automatically the ones most likely to remain useful out of sample. Visual selection therefore starts with the stable neighborhood, not with the single highest tile.
A channel-breakout design under test
A channel-breakout design places daily bands around price and generates entries when a bar penetrates the upper or lower band, so large directional moves are not skipped by construction.
In the volatility-channel variant, band distance equals average true range times a coefficient. Suggested search ranges are ATR lengths of one to seven periods and coefficients from 0.2 to 1.4.
After each close the point move is added to and subtracted from that close to set the next session’s long and short targets, which can be worked as resting orders.
Separate long-side and short-side coefficients can replace a single symmetric multiple so the two bands need not sit the same distance from the close. Those two coefficients become the axes of the surface that robustness testing inspects.
What one walk-forward comparison reported
In one reported walk-forward comparison, visually chosen robust settings produced 5.84 times as much profit per trade as profit-maximizing settings, and later captured 95.68% of a fully optimized last-year result with 18.18% fewer trades.
The same surface-chart selection process was also applied to a single-stock series, where up and down coefficients identified neighborhoods that remained productive on unused data.
Those archive comparisons support reading the plateau first and only then sending a nearby setting through walk-forward analysis. They do not identify a permanent parameter set.
Walk-forward equity of the S&P channel-breakout system
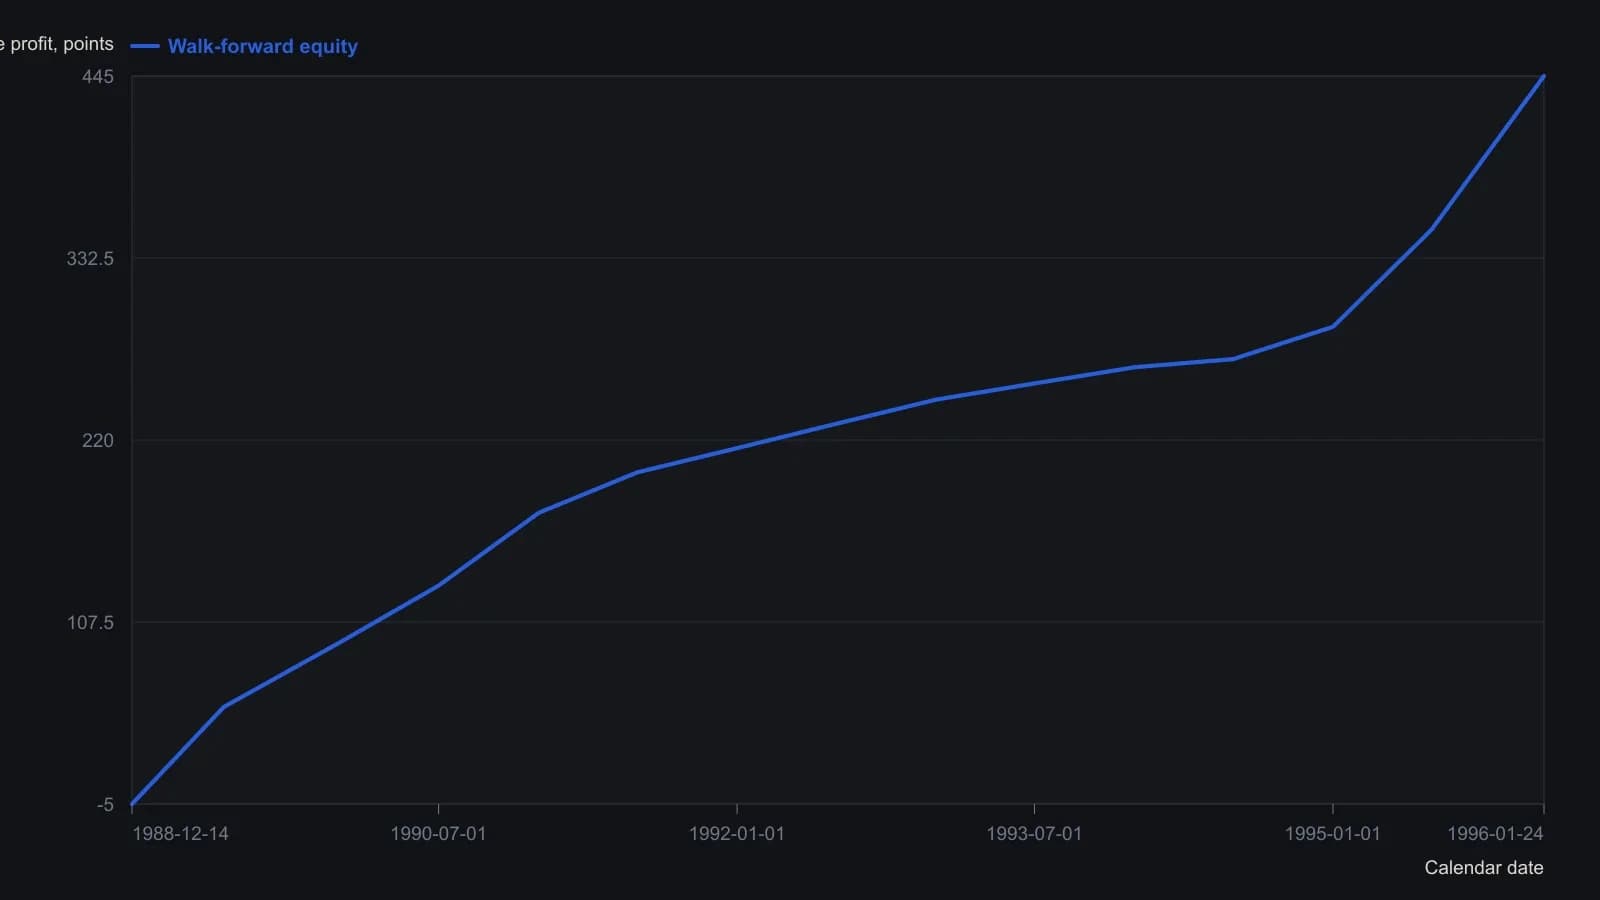
Heights are approximate readings from the raster; the article states the test used the S&P 500 continuous contract from 14 December 1988 to 24 January 1996, with later data held out. Header figures on the companion surface (period 4, up 0.6, down 0.2, profit 477.98, 378 trades) belong to a different parameter tile and are not this series.
All readings on this track · 51 readings
- 1986Degrees of freedom in trading system optimization
- 1988Walk-forward and neighborhood tests after optimization
- 1988Undisclosed rules block system robustness tests
- 1988Testing re-optimization calendars against random parameter controls
- 1989Binary search limits on multi-peak average grids
- 1989Parameter neighborhoods that survive a shift
- 1990Use profit mapping to keep a cycle and stop plateau
- 1990Why popular indicator optimization fails robustness
- 1991Retesting weighted indicator balances across horizons
- 1992Constructing forecast models with regression, walk-forward, and robustness
- 1992Diagnose regimes before you lock parameters
- 1992When stops change system timing
- 1993Walk-forward halt rules for forecast models
- 1994Walk-forward evaluation of genetic index rules
- 1995Input pruning as walk-forward system evaluation
- 1995Critiquing neural nets as incomplete trading systems
- 1996Rebuild the equity-path ratio before it ranks a designed system
- 1996Parameter grids can fit random walks
- 1996Walk-forward analysis belongs in the design of a mechanical trading system
- 1997When a holdout fails, discard the rule set
- 1997Test rewarded rule breaks before replacing the system
- 1997Walk-forward rules keep system research from rewriting live trades
- 1999Keep a channel-breakout to two lookbacks and test neighbor stability
- 1999Constant investment size in stock system evaluation
- 2000Forcing optimization maps mechanical system failure boundaries
- 2000Robust parameter selection with surface charts
- 2001A two-gate classroom test for a two-window momentum trend filter
- 2002How a two-sided continuation factor becomes a testable trend rule
- 2002Evaluating two-window trend intensity as a reversal rule
- 2003Discounting speculative bubbles in system robustness tests
- 2003Walk-forward evaluation of locked stochastic oscillator rules
- 2003Critiquing mechanical system design after extreme price regimes
- 2004Evaluating a two-window trend trigger
- 2005Grade backtested signals with holdouts and optimization plateaus
- 2006Reserved-sample evaluation of trading system design
- 2006Walk-forward critique of hindsight crossover systems
- 2008Condition-matched walk-forward evaluation for mechanical systems
- 2011Session-split evaluation of regular and overnight systems
- 2012Walk-forward evaluation as operator rehearsal
- 2013Two-window evaluation of mechanical trading systems
- 2013Walk-forward filter selection for repeated-median velocity
- 2014Walk-forward evaluation for fading-memory velocity systems
- 2015Test oscillator events before tuning rules
- 2016Walk-forward evaluation of a five-parameter parabolic stop-and-reversal
- 2016Walk-forward optimization without curve fitting
- 2017Optimization without overfitting in trend-system evaluation
- 2017Parameter stability is a better guide than a larger crossover grid
- 2018Point-in-time universes for system evaluation
- 2018Walk-forward robustness evaluation for optimized systems
- 2018Critiquing breakout systems through robustness tests
- 2018A critique of parameter fitting in system design