2002issue C061-6
Evaluating throwbacks and pullbacks after triangle breakouts
Treat the first 30-day white-space loop back to a triangle as a congestion-and-volume exam. If nearby shelves and the breakout's volume profile make a return likely, the breakout remains a falsifiable hypothesis rather than a finished signal.
- A throwback or pullback is identified only when price returns to or near the breakout within 30 days and leaves white space against the pattern.
- Overhead resistance, prior flat ranges, a preexisting downtrend, and a shared-price support band below the triangle were used to anticipate the loop.
- High-volume upward breakouts were generally more likely to throw back, while pullbacks were more often tied to quieter downward breakouts.
- After the loop, price is described as usually resuming the breakout direction unless nearby support or resistance dominates, and it rarely crosses the opposite side of the pattern.
Three tests for the first loop
A throwback is identified only when price returns to or near the upward breakout or trendline, finishes that return within 30 days, and leaves white space between the loop and the pattern instead of sliding along the boundary. A pullback uses the same three tests after a downward breakout and is treated as an inverted throwback that curls up toward the breakout line or formation boundary.
The 30-day limit is an arbitrary cutoff used to separate a throwback or pullback from later ordinary price movement. The breakout price is the price or trendline level at which the triangle is considered to have exited, and it is the level that return must approach.
Best Buy throwback after the ascending-triangle breakout
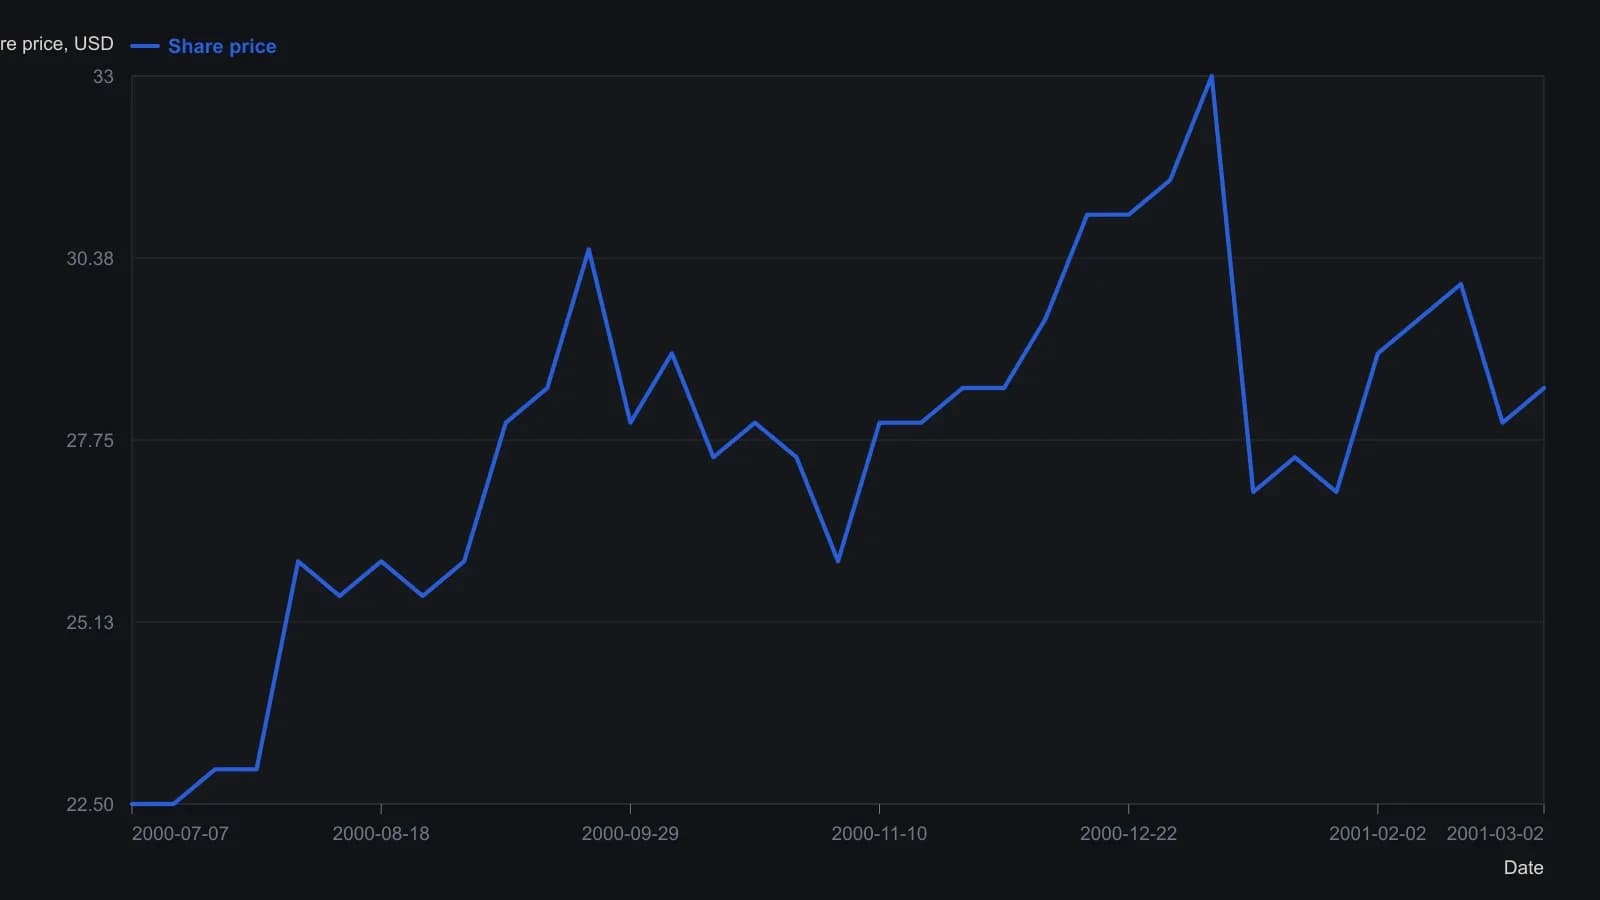
The source prints daily OHLC with no numeric table, so these are raster readings at half-dollar resolution, sampled about weekly, with the September peak and November retest kept so the loop is visible. Bulkowski counts a throwback only when the return finishes within 30 days and leaves white space against the triangle.
The triangle as the reference
An ascending triangle is described with a flat top, a rising lower boundary, and receding volume. An early one-day spike through the lower line can be ignored when it occurs too soon in the pattern's development.
Ascending, descending, and symmetrical triangles are contracting structures whose breakout line is the reference for later throwback or pullback tests. The loop is scored against that line, not against every later swing.
Nearby shelves as the congestion exam
Overhead resistance, prior flat ranges, and a preexisting downtrend were used to anticipate a throwback after an upward triangle breakout. A horizontal consolidation region sharing a common price below a triangle was treated as a support zone that can stall or reverse a downward breakout into a pullback.
That region is a prior band of flat tops, flat bottoms, or both. When it sits near the new exit, the breakout is still a hypothesis: price may curl back to the breakout price before the direction of the exit can be read as continuation.
Breakout volume and the later stall
Volume-price analysis reads breakout participation against the later loop. High-volume upward breakouts were generally more likely to throw back than quieter ones, while pullbacks were more often tied to quieter downward breakouts. Quieter or heavier participation is also used to judge whether continuation after the loop tends to be stronger or weaker.
After a throwback completes, price is described as usually resuming the prior climb. After a pullback completes, price is described as typically declining, with the opposite path when nearby resistance or support dominates. After the loop, price usually stalled near the breakout in about 50 percent to 75 percent of cases and only rarely, usually in fewer than 10 percent of cases, traveled through the opposite side of the pattern.
How often the loop appeared in the sample
In the tabulated sample, throwbacks after upward breakouts appeared least often in descending triangles at 29 percent and most often in Adam-and-Adam double bottoms at 65 percent. Pullbacks after downward breakouts ranged from 43 percent for ascending triangles to 61 percent for Eve-and-Eve double tops.
All readings on this track · 10 readings
- 1991GM support and resistance role reversal
- 2002Evaluating throwbacks and pullbacks after triangle breakouts
- 2002Spike-shaped double bottoms as a three-gate chart drill
- 2003Constructing bullish bottom patterns from structure and confirmation
- 2003Classifying breakout gaps by fill speed and throwback
- 2006The J-hook as two gates: rounded pullback and prior-high breakout
- 2006Evaluating double tops with a throwback clock
- 2007Check duration, breakout labels, and throwback timing before rectangle measuring rules
- 2016Confirmed double-bottom, later pennant, and throwback as separate checkpoints
- 2020Late double-bottom entries after throwbacks