2003issue C051-4
Building flags, pennants, and triangles as continuation pauses
This editorial walk-through treats continuation setups as assemblies you can draw and then reject. Lock the parent trendline, box the pause as a flag, pennant, or triangle, and let contracting or expanding volume decide whether the resume-the-trend reading still stands.
- Chart patterns are recurring high-low-open-close relationships that carry a probability, not a certainty, of a similar later price movement.
- Build the parent trend first with sequential higher highs and higher lows, or lower highs and lower lows, then a trendline whose confirmed break ends that construction.
- Flags, pennants, and triangles are drawn as compact or contracting pauses that rest the prior trend rather than complete a reversal.
- Volume confirmation is a fade through the pause; expansion or unsupportive activity is an early warning that the continuation reading may break down.
Continuation pauses, not certainties
Chart patterns are treated as recurring high-low-open-close relationships that carry a probability, not a certainty, of a similar later price movement.
Continuation or consolidation patterns are constructed as pauses inside a dominant trend after which price is expected to resume that trend. A continuation pattern is that drawn pause: it is hypothesized to resolve in the prior direction rather than reverse it. A reversal pattern instead warns that the prevailing trend may be changing direction.
Lock the parent trendline
An uptrend is constructed as sequential higher highs and higher lows with a trendline along at least two higher lows. A downtrend is sequential lower highs and lower lows with a trendline along the lower highs in at least two and preferably three places. A confirmed break of that line ends the construction.
Trend construction has no fixed clock. The same higher-high or lower-high geometry can be drawn on intraday or multi-month data, and longer constructions are treated as more reliable.
Editorial reading: lock that parent trendline before you box the pause. If the line has already taken a confirmed break, the form is no longer a pause inside a living trend construction.
Box the pause as a flag, pennant, or triangle
Flags and pennants are constructed as compact continuation pauses, grouped with wedges, that appear after a directional run. They are read as rest intervals rather than completed reversals. A flag is a compact, typically sloped rectangular pause after a directional run. A pennant is a small contracting pause after a directional run.
Descending, ascending, and symmetrical triangles are constructed as members of the continuation family. They are drawn as contracting ranges that pause, rather than reverse, the prior trend. An ascending triangle is a contracting range with a flat upper boundary and a rising lower boundary. A descending triangle is a contracting range with a flat lower boundary and a falling upper boundary. A symmetrical triangle is a contracting range of lower highs and higher lows.
Let volume accept or reject the reading
Declining volume across the life of the pause is used as construction evidence that the form is a continuation pattern rather than a finished trend change. That fade in activity is volume confirmation for the continuation reading.
If volume expands instead of contracts through a downward flag or pennant while price is falling, the construction is treated as bearish and the expected bounce at the end of the pattern may fail or last only briefly.
Volume that fails to support the drawn flag, pennant, or triangle is used as an early warning that sentiment is shifting and that the expected continuation outcome may break down. Rising activity against the expected resolution is the other side of volume confirmation: it rejects the continuation reading.
Editorial reading: contracting volume keeps the assembly standing. Expanding or unsupportive volume is how the resume-the-trend hypothesis is thrown out.
Nordstrom daily closes through flag, pennant, triangle and wedge pauses
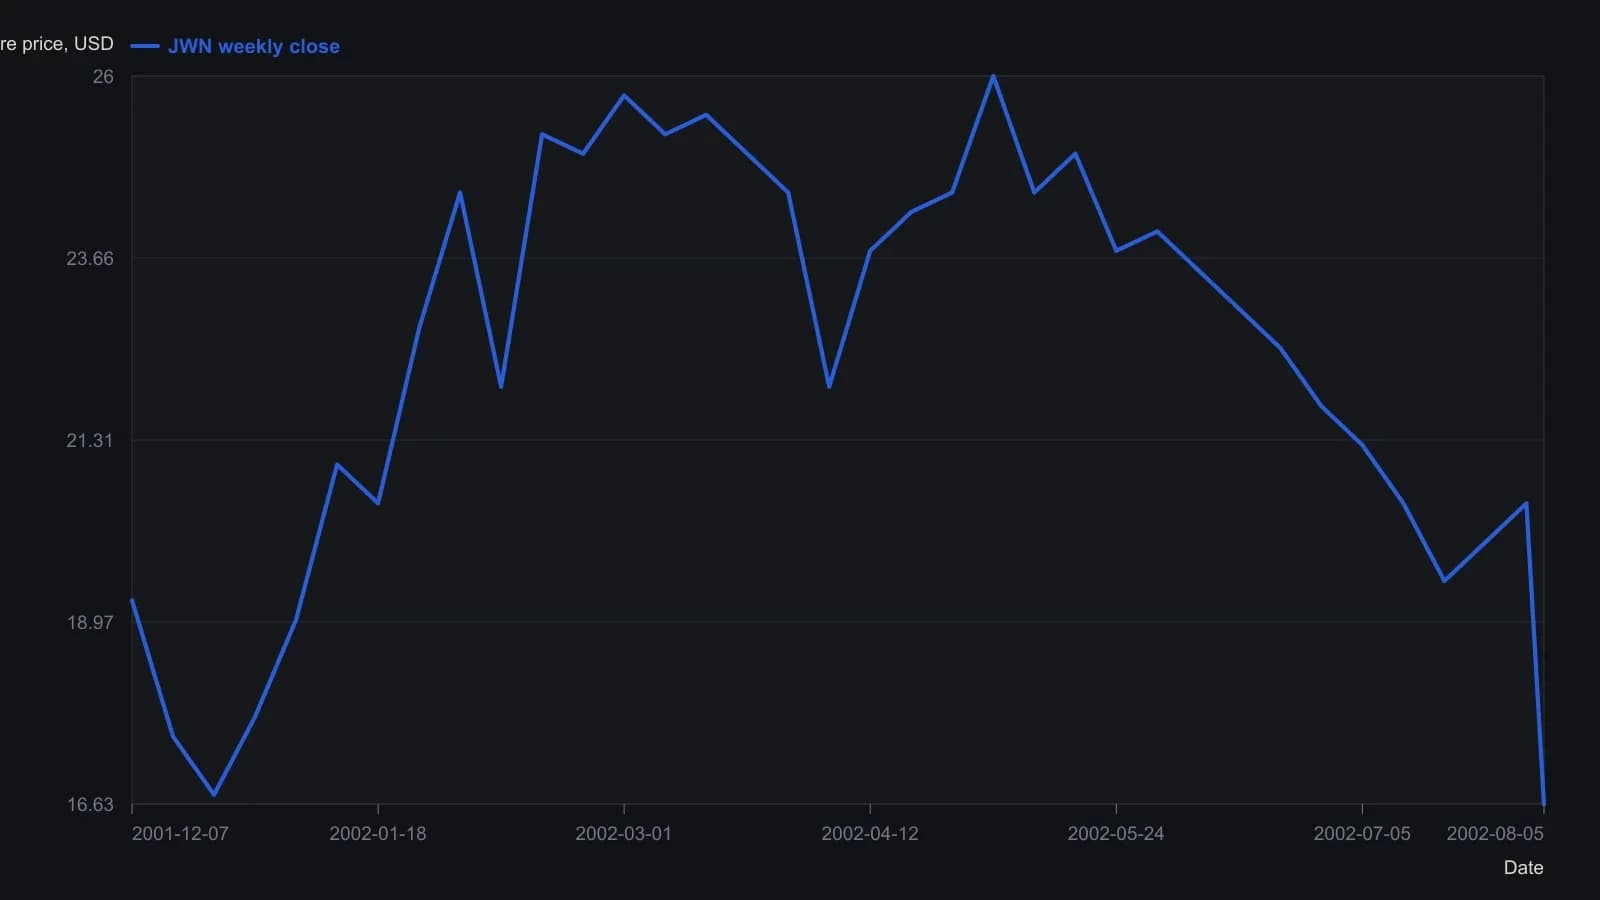
Points before 5 August 2002 are weekly closes digitized from the raster to the nearest quarter-dollar. The 5 August 2002 close of 16.63 is the value printed on the chart. Volume and Chaikin money flow sit in separate panes and are not plotted here.
All readings on this track · 26 readings
- 1986Constructing bounded relative-strength overlays from oscillator limits
- 1989Point-and-figure fulcrum, count, and flag as three jobs
- 1996The high, tight flag as a three-checkpoint continuation exam
- 2000Test chart patterns with confirmation, not names
- 2001Failed chart patterns as reverse breakout signals
- 2002Ascending triangle and flag: a three-checkpoint QQQ case study
- 2002Two-stage chart reading after breakouts
- 2002The second pattern after a breakout
- 2003Building flags, pennants, and triangles as continuation pauses
- 2003When trendline channels age into a wedge or a break
- 2004Bearish chart patterns need confirmation before the turn
- 2004Constructing flags, pennants, and triangles from swing pivots
- 2005Constructing flag and pennant rules from pole to exit
- 2005Fanline construction for testing trend health
- 2005When flag-and-pennant breakout scans fail a measurement audit
- 2006Testing a bear-flag target after the pause is confirmed
- 2007Homebuilder rebound as a bear-flag, trendline, and volume case study
- 2008Completed chart patterns as reward-to-risk arithmetic
- 2012Reading this file
- 2012Reading regime change: when to stop trading
- 2014Intraday flag construction with breakout and stop rules
- 2015Lock lookback and chart scale before you mark a flag or pennant
- 2017Constructing delayed buy-stops on bull flags and pennants
- 2018Copy an ABC swing as a ruler, then test flags and Fibonacci degree
- 2019Failed flags, pennants, and triangles as a completed experiment
- 2020Confirming candlestick and flag signals on a weekly chart