2017issue C1216-21
Supply and demand zones as bounded swing maps
The archive treats a swing as travel between leftover buy and sell bands. Mark the origin of a strong departure as a demand or supply zone, wait for a later retest, and accept the setup only after the stop at the far side of that band and the target short of the next opposing zone are written down.
- Mark a demand zone with a rally-base-rally and a supply zone with a rally-base-drop at the origin of a strong, prolonged departure.
- Treat a later retest as the working setup, and treat each extra visit as zone-retest decay that uses up unfilled orders.
- Check the higher-timeframe tide, a chart about five to seven times larger, so the swing is not taken against a larger opposing zone.
- Before entry, state the acceptable loss, bind the stop to the zone edge, and pull the opposing-zone target short of known opposing pressure.
A swing as leftover buy and sell interest
The archive describes price as moving when willing buyers and sellers are unequal at a given level. Excess demand lifts price. Excess supply lowers it. After a strong, prolonged departure, the origin of that move is treated as the working support or resistance: a demand zone if buyers absorbed sellers and price left higher, or a supply zone if sellers overwhelmed buyers and price left lower.
TradersWeek editorial reading: those leftover orders can be treated as a map of institutional inventory. A swing is then a planned trip from a later retest of that band toward the next opposing zone, accepted only when the stop at the far side of the band and the target short of the next opposing zone are both written down before entry.
How the bands are marked
A rally-base-rally is used to locate a demand zone: an advance, a sideways pause, then a strong continuation higher, with leftover buy interest expected if price later returns. A rally-base-drop locates a supply zone: an advance, a pause, then a decline, with leftover sell interest expected on a later visit.
The same zone-reading steps are shown on monthly, weekly, daily, and 60-minute charts, and across equity, commodity-linked, and currency-futures examples.
A daily case from band to band
On one daily case, two demand bands were marked at 240.02 to 246.73 and 257.30 to 263.26, with a supply band at 307.28 to 302.58. Later price action is described as traveling from one band toward the opposite band.
After a gap into the marked supply band, that case shows a same-session selloff of almost 6 percent. After a gap to the 263.26 demand band, price probed the band over two sessions and then advanced for about a week.
The same imbalance map on other charts
A December 2016 to February 2017 currency-futures case marks supply-zone pullbacks that were followed by declines, an April 2017 demand-zone retest that was followed by a rally, and a June 2017 supply-zone visit that left with a downward gap.
Weekly and 60-minute examples mark discrete levels to show the same map at different chart scales: 28.38 and 13.81 as supply, and 12.68 and 13.11 as demand.
URA weekly swings between leftover supply and demand
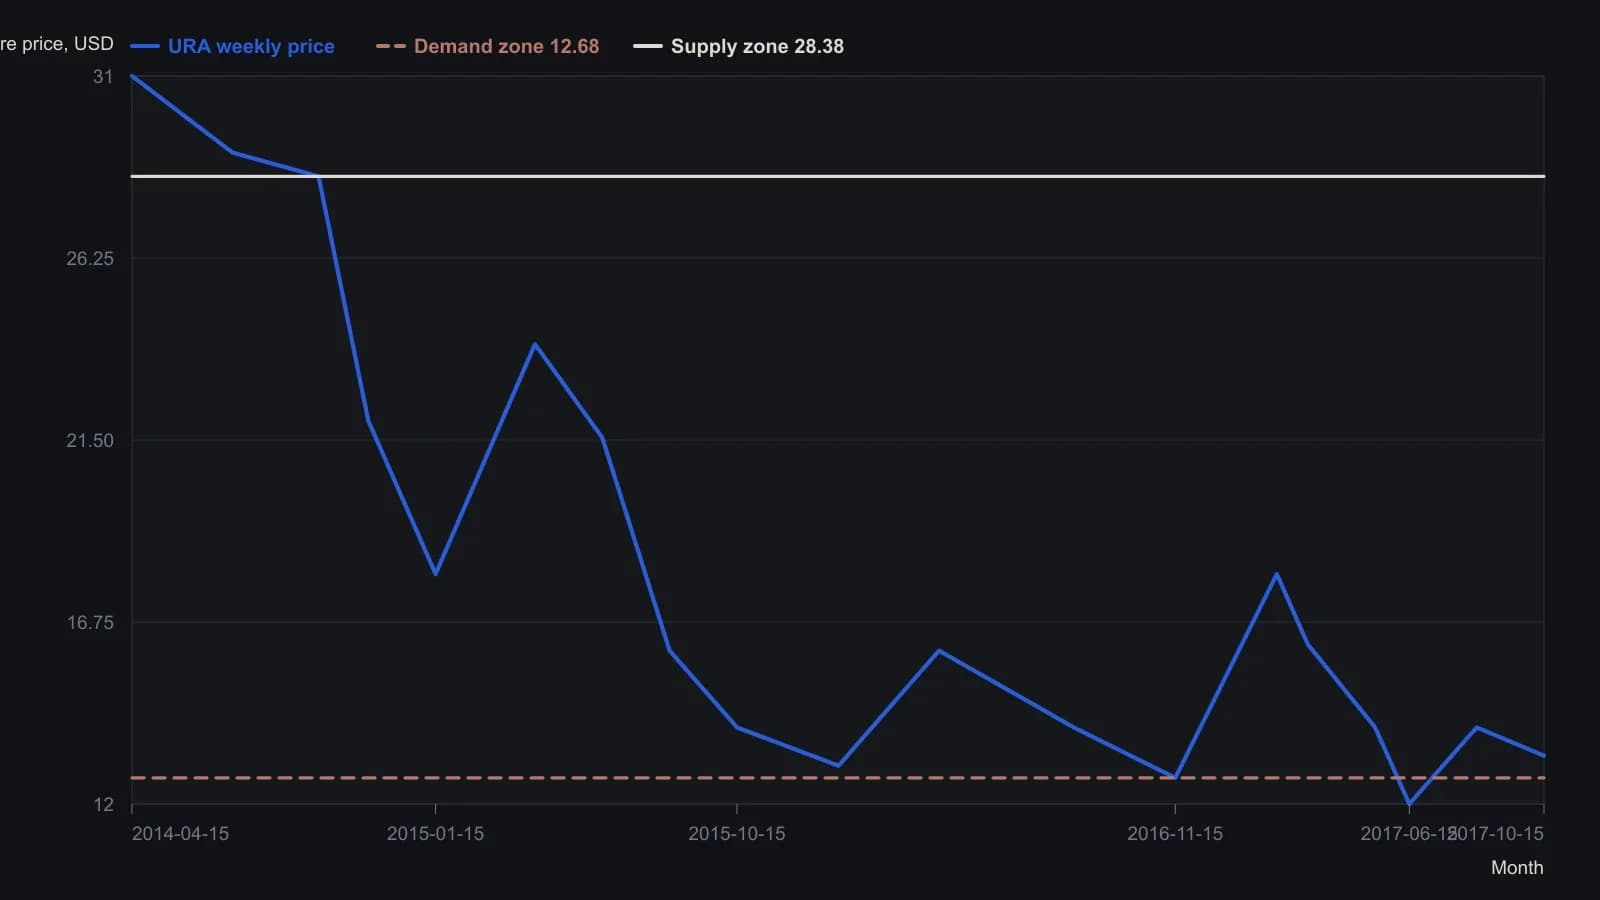
Price is swing-sampled from weekly candles rather than every close. Unlabeled points are rounded to the nearest dollar; labeled zone edges keep the printed values.
Check the higher-timeframe tide
The procedure treats the origin of a strong, prolonged departure as the working support or resistance, then checks a higher-timeframe tide: a chart roughly five to seven times larger than the working timeframe. The check is there so a swing is not taken against a larger opposing zone.
Write the stop and the opposing-zone target first
Each additional retest is described as using up unfilled orders in the zone. That zone-retest decay is said to reduce the chance that later tests will hold.
Before entry, the trader is told to state the acceptable loss, keep the stop bound to the zone edge, and pull a target short of the next opposing zone. The opposing-zone target is the next mapped supply or demand band, used so a swing is not held into known opposing pressure.
All readings on this track · 35 readings
- 2001Swing trading with trailing stops and fixed loss exits
- 2003Linear regression swing alerts and trailing stops
- 2005Range-width gates for swing entries at base edges
- 2006Beyond setups: a six-factor trading process
- 2007Angle of ascent, chart scale, and style-fit
- 2010Stacking a short-horizon oscillator with a moving average and swing hold rules
- 2010A weekly contest long treated as one swing procedure
- 2011Four-color volume-price states for long-only swing actions
- 2012Classify momentum, velocity, or volatility before the swing signal
- 2013Swing rules as a portable entry and exit procedure
- 2013Constructing paired percent-b and stochastic swing oscillators
- 2013Give the fast band line and the slow stochastic complementary jobs
- 2013Smoothed percent-b divergences for numbered swing-wave rules
- 2013Portable swing rules for candle turns and a 1-2-3 wave count
- 2013A three-average swing and breakout case study
- 2013Constructing swing trades with a fifty-day average and a five-bar exponential average
- 2014From aliasing and dilation to a roofed stochastic swing
- 2014Channel width and trend-filter lookback as separate swing-trading choices
- 2016Constructing volume-confirmed multiday breakout swings
- 2017Constructing swing signals from a volume-weighted average cross
- 2017Golden-cross swing entry with a trailing-stop exit
- 2017One swing procedure: group leadership first, then a volume-price leave
- 2017Four-day green-candle breakout entry as one swing procedure
- 2017Swing pivots need a 100-period crossover and a breakout candle
- 2017Supply and demand zones as bounded swing maps
- 2018Three-bar volume-confirmed swing breakout
- 2018Tight stops first on swing breakouts with a range filter
- 2018Constructing trend and swing rules from horizon to crossover
- 2019Decade-level breakouts as one closed swing procedure
- 2019Inverse-pair swing trading with a shared buy-stop
- 2019Week-range next-day breakout on bitcoin pairs
- 2019Ranking strength before confirming a multi-timeframe breakout
- 2019Forty-five-degree multi-week swing breakout as a closed procedure
- 2020A dual pending-stop pair as one bitcoin swing construction
- 2020High-low activator, directional oscillator, and momentum swing agreement