2013issue C1257-60
A three-average swing and breakout case study
A swing-trading case study enters only after a long-horizon moving-average already defines direction and price then breaks a short-horizon average of highs or lows. The opposite side of that channel is the channel-stop. Historical futures and stock-list files also record short rules being commented out after that side reduced results in sample.
- A swing-trading entry waits for a short-horizon breakout only when a longer-horizon moving-average already defines direction.
- The breakout-system threshold is a short-horizon average of highs or lows, and the opposite extreme becomes the channel-stop once a position is open.
- The trend-filter is the long-horizon exponential average that must already stand on the same side of price before a channel breakout can become an entry.
- A futures workflow optimized those averages with the breakout add-on held at zero, then commented the short rules out of the published code file after that side reduced results.
What the procedure does
The case-study procedure is a swing-trading rule set built from three moving-average pieces. A long-horizon exponential average is the trend-filter. Two short-horizon simple averages, one of highs and one of lows, form a channel. A breakout-system signal can fire only when price crosses that channel and the trend-filter already agrees.
Editorial reading: TradersWeek treats this as a single testable procedure. One trend-filter, one channel breakout, and one channel-stop are coded together, and the historical files also document a habit of disabling the side that fails in sample.
Entry, exit, and the converse short
The procedure enters long only when the prior close is already above a 50-period exponential average and price then breaks above a five-period simple average of daily highs.
Once long, the same procedure exits when price closes below the five-period simple average of daily lows. The short-horizon channel is both the entry trigger and the trailing stop. After a long is open, that trailing level is the short-horizon average of lows, the channel-stop.
Short entries and cover exits are defined as the converse of the long rules. A short needs a close below the short-horizon average of lows, with the long-horizon average already confirming the down side.
Futures parameters and the disabled short side
A futures implementation optimized an exponential-average length used as a trend-filter together with a simple-average length of highs and lows, while holding the breakout add-on at zero.
In that same 1982 to 2013 S&P futures simulation, short-side rules reduced results and most tested parameter pairs produced a negative profit, so the short rules were commented out of the published code file.
The published long-side parameter choice from that optimization was an exponential-average length of 250, a high/low simple-average length of 20, and a breakout amount of 0.
Stock-list comparison and coded inputs
A stock-list implementation compared equity curves of the original three-indicator swing rules against a modified version on the NASDAQ 100 universe from 5 January 2000 through 9 October 2013.
The coded inputs include a 50-period exponential average, a 5-period simple average, a 200-period long-term exponential average, a 10-period average true range, and optional NDX-based averages used as additional filters.
A later recast of the same averages
Independent platform notes recast the same three averages as a momentum/breakout channel. Two five-period high/low averages form the channel and a 50-period average sets trend direction. Those notes include a plotted four-hour EUR/JPY example.
Citigroup equity under the three-average swing
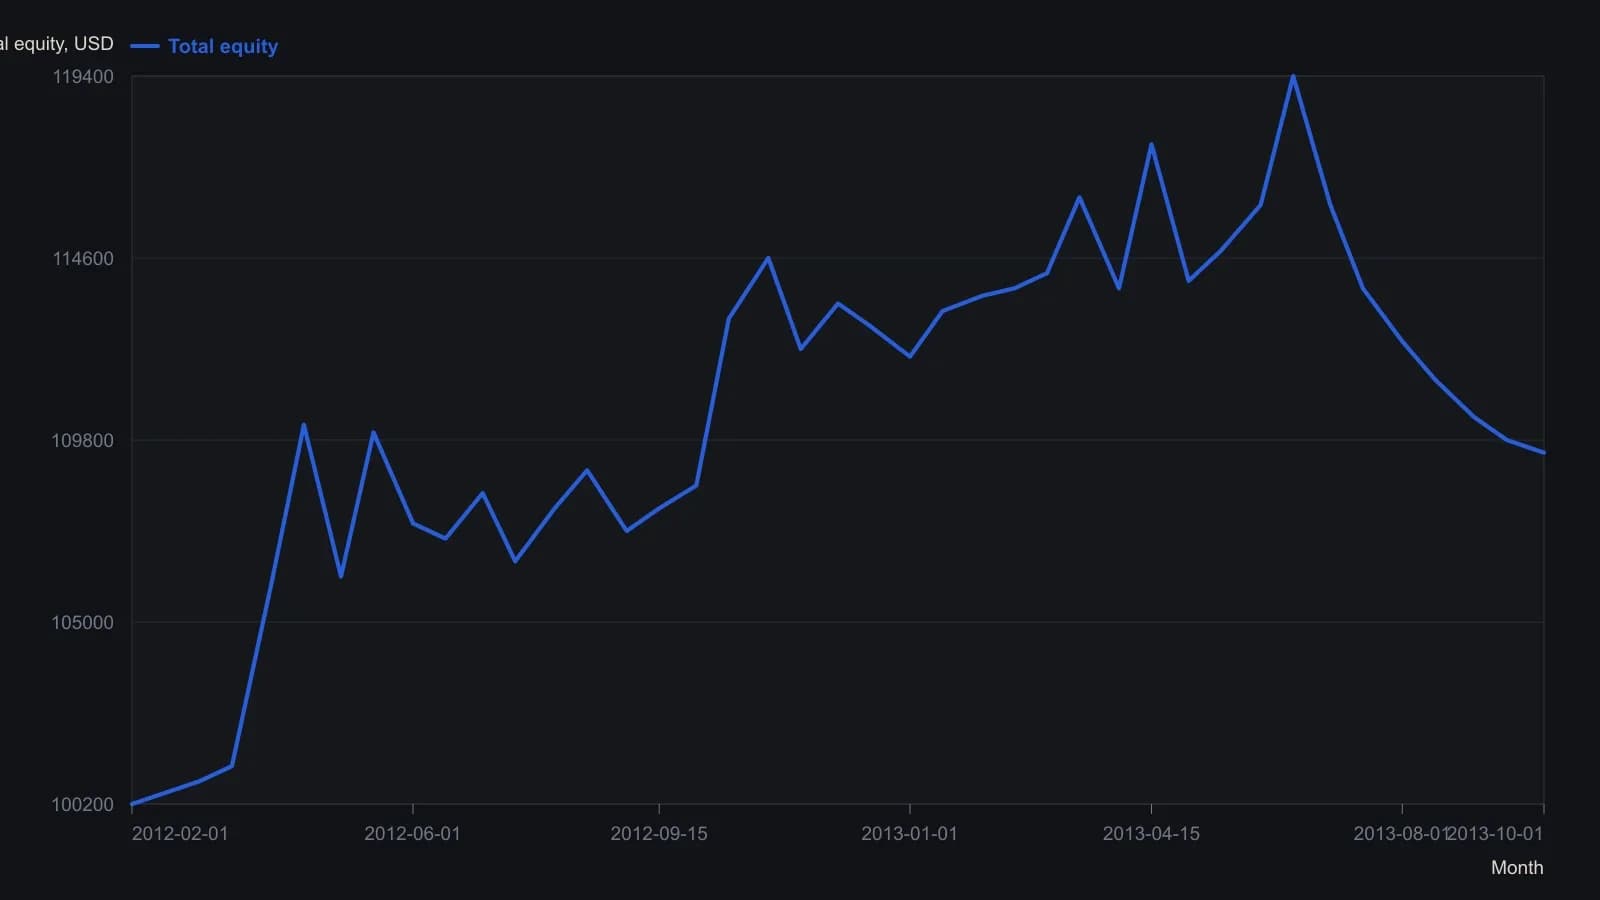
The vendor test used Citigroup from January 2012 through September 2013 and risked 1 percent of equity per trade. The published figure is a log-scale raster, so dates and dollar readings between labeled ticks are approximate.
All readings on this track · 35 readings
- 2001Swing trading with trailing stops and fixed loss exits
- 2003Linear regression swing alerts and trailing stops
- 2005Range-width gates for swing entries at base edges
- 2006Beyond setups: a six-factor trading process
- 2007Angle of ascent, chart scale, and style-fit
- 2010Stacking a short-horizon oscillator with a moving average and swing hold rules
- 2010A weekly contest long treated as one swing procedure
- 2011Four-color volume-price states for long-only swing actions
- 2012Classify momentum, velocity, or volatility before the swing signal
- 2013Swing rules as a portable entry and exit procedure
- 2013Constructing paired percent-b and stochastic swing oscillators
- 2013Give the fast band line and the slow stochastic complementary jobs
- 2013Smoothed percent-b divergences for numbered swing-wave rules
- 2013Portable swing rules for candle turns and a 1-2-3 wave count
- 2013A three-average swing and breakout case study
- 2013Constructing swing trades with a fifty-day average and a five-bar exponential average
- 2014From aliasing and dilation to a roofed stochastic swing
- 2014Channel width and trend-filter lookback as separate swing-trading choices
- 2016Constructing volume-confirmed multiday breakout swings
- 2017Constructing swing signals from a volume-weighted average cross
- 2017Golden-cross swing entry with a trailing-stop exit
- 2017One swing procedure: group leadership first, then a volume-price leave
- 2017Four-day green-candle breakout entry as one swing procedure
- 2017Swing pivots need a 100-period crossover and a breakout candle
- 2017Supply and demand zones as bounded swing maps
- 2018Three-bar volume-confirmed swing breakout
- 2018Tight stops first on swing breakouts with a range filter
- 2018Constructing trend and swing rules from horizon to crossover
- 2019Decade-level breakouts as one closed swing procedure
- 2019Inverse-pair swing trading with a shared buy-stop
- 2019Week-range next-day breakout on bitcoin pairs
- 2019Ranking strength before confirming a multi-timeframe breakout
- 2019Forty-five-degree multi-week swing breakout as a closed procedure
- 2020A dual pending-stop pair as one bitcoin swing construction
- 2020High-low activator, directional oscillator, and momentum swing agreement