2010issue C0214-23
Stacking a short-horizon oscillator with a moving average and swing hold rules
Editorial reading: a multi-day swing is a stacking problem rather than a single-line hunt. A short-horizon stochastic-oscillator asks whether momentum has left its midpoint, a moving-average asks whether that midpoint-cross still aligns with a slower path, and the swing-trading layer asks whether the combined state is worth holding for a few days to a few weeks rather than fading on the next bar.
- A 14-period relative-strength lookback often stays between 30 and 70 and can miss short-horizon swing turns, while observed swing starts and ends often coincide with a three-period reading crossing 50.
- A three-period simple moving average of that series damps smaller fluctuations, and marks at 80 and 20 are stretch-warning flags rather than automatic entries or exits.
- Overlay-color-state follows whether the three-period reading is above or below 50, but rapid flips, a smoothed-oscillator lingering around 50, average true range below 2, or average directional index below 20 can mark range-constriction.
- A common swing-trading entry is a pullback-to-average toward a 50-period exponential moving average after a prior trend, then an overlay color change back in that trend direction.
Reading a swing as a stack
Editorial note: treat a multi-day swing as a stacking problem rather than a single-line hunt. A short-horizon stochastic-oscillator answers only whether momentum has left its midpoint. A moving-average answers whether that midpoint-cross is still aligned with a slower path. The swing-trading layer answers whether the combined state is worth holding for days rather than fading on the next bar.
In the archive workflow, the swing-trading layer is a holding period of a few days to a few weeks rather than a long-horizon trend trade. Entry, exit, and abstention belong to one testable rule set.
A shorter lookback and the midpoint-cross
A 14-period relative-strength lookback often stays between its conventional 30 and 70 bands for long stretches and can miss short-horizon swing turns.
Shortening that lookback to three periods raises sensitivity to smaller price moves. The raw reading can produce many false signals if it is used alone.
Observed swing starts and ends often coincide with the three-period reading crossing its 50 line rather than the conventional 30 and 70 extremes. That midpoint-cross is the directional change that begins or ends a swing. The procedure applies a stochastic-oscillator reading style to this three-period relative-strength series.
Overlay-color-state on the price pane
Price bars can be colored by whether the three-period reading is above or below 50. Overlay-color-state makes a change from downswing to upswing, or the reverse, visible on the price pane.
The smoothed-oscillator and stretch warnings
A three-period simple moving average of the three-period relative-strength series is used to damp smaller fluctuations. That moving-average of the short-horizon oscillator is the smoothed-oscillator.
Stretch bands on the smoothed-oscillator are read at 80 and 20 rather than 70 and 30. Marks plotted when the smoothed reading rises above 80 or falls below 20 are stretch-warning flags, not automatic entry or exit triggers. They are used to tighten risk or watch for a turn.
Withholding the hold in range-constriction
In a narrow sideways channel the overlay can flip color every bar or two. That range-constriction is a non-swinging state, and a swing-trading hold should be withheld.
The same state can be flagged when the smoothed-oscillator lingers around 50, when average true range stays below 2, or when the average directional index stays below 20.
A pullback-to-average trigger
A common swing-trading entry waits for price to pull back toward a 50-period exponential moving average after a prior trend. That slower moving-average marks the path for a pullback-to-average.
The testable trigger is an overlay-color-state change back in the trend direction.
Boeing RSI MA versus stretch lines at 80 and 20
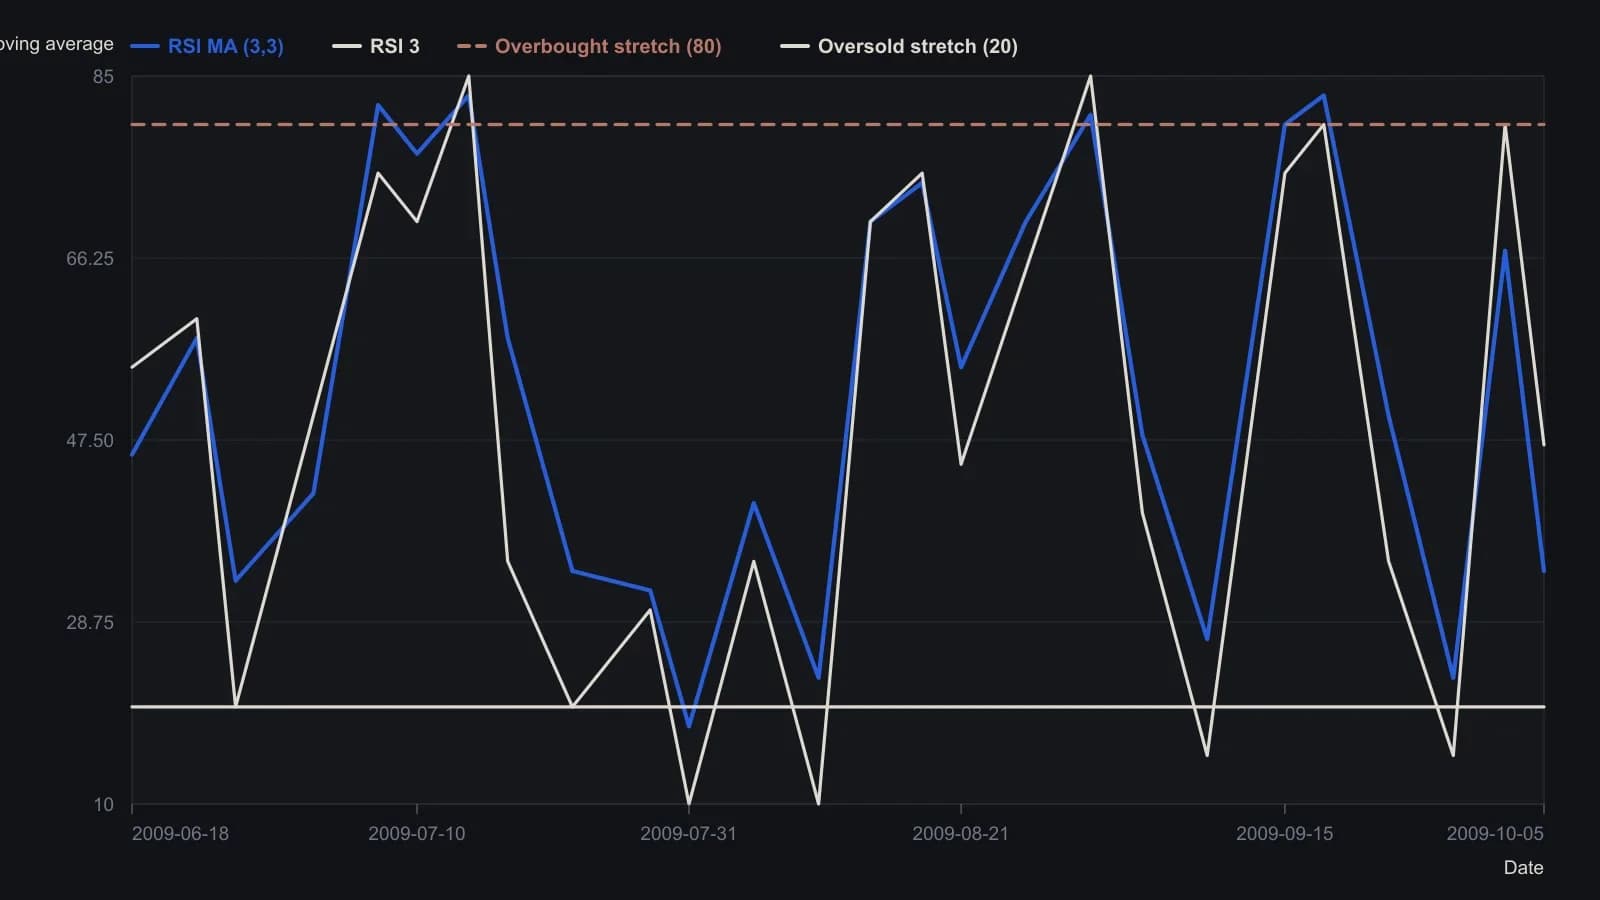
Star fixes RSI length at 3 and the smoothing average at 3, and she substitutes 80/20 stretch lines for the usual 70/30. Dates follow the figure’s June–October 2009 session axis; oscillator readings are approximate because they were taken from the plotted panes rather than a printed table.
What each layer answers
Editorial note: the stochastic-oscillator layer is read for midpoint-cross changes and, after smoothing, for stretch extremes. The moving-average layer damps one-bar flicker and marks a slower path for pullback entries. The swing-trading layer opens, manages, and exits over a few days to a few weeks only when the stacked state is present and range-constriction is absent.
All readings on this track · 35 readings
- 2001Swing trading with trailing stops and fixed loss exits
- 2003Linear regression swing alerts and trailing stops
- 2005Range-width gates for swing entries at base edges
- 2006Beyond setups: a six-factor trading process
- 2007Angle of ascent, chart scale, and style-fit
- 2010Stacking a short-horizon oscillator with a moving average and swing hold rules
- 2010A weekly contest long treated as one swing procedure
- 2011Four-color volume-price states for long-only swing actions
- 2012Classify momentum, velocity, or volatility before the swing signal
- 2013Swing rules as a portable entry and exit procedure
- 2013Constructing paired percent-b and stochastic swing oscillators
- 2013Give the fast band line and the slow stochastic complementary jobs
- 2013Smoothed percent-b divergences for numbered swing-wave rules
- 2013Portable swing rules for candle turns and a 1-2-3 wave count
- 2013A three-average swing and breakout case study
- 2013Constructing swing trades with a fifty-day average and a five-bar exponential average
- 2014From aliasing and dilation to a roofed stochastic swing
- 2014Channel width and trend-filter lookback as separate swing-trading choices
- 2016Constructing volume-confirmed multiday breakout swings
- 2017Constructing swing signals from a volume-weighted average cross
- 2017Golden-cross swing entry with a trailing-stop exit
- 2017One swing procedure: group leadership first, then a volume-price leave
- 2017Four-day green-candle breakout entry as one swing procedure
- 2017Swing pivots need a 100-period crossover and a breakout candle
- 2017Supply and demand zones as bounded swing maps
- 2018Three-bar volume-confirmed swing breakout
- 2018Tight stops first on swing breakouts with a range filter
- 2018Constructing trend and swing rules from horizon to crossover
- 2019Decade-level breakouts as one closed swing procedure
- 2019Inverse-pair swing trading with a shared buy-stop
- 2019Week-range next-day breakout on bitcoin pairs
- 2019Ranking strength before confirming a multi-timeframe breakout
- 2019Forty-five-degree multi-week swing breakout as a closed procedure
- 2020A dual pending-stop pair as one bitcoin swing construction
- 2020High-low activator, directional oscillator, and momentum swing agreement