2007issue C091-5
Angle of ascent, chart scale, and style-fit
Angle of ascent is the slope of the latest price path on a chart scaled to the intended hold. It is distinct from a trendline. The same path can look moderate on one lookback and too steep on another, so chart scale and style-fit come before any entry reading.
- Angle of ascent is the slope of the most recent price path on a style-appropriate chart, and it is distinct from a trendline, which is treated as valid only after at least three touches.
- Chart interval and history length must match the intended hold before slope is judged, because the same stock can look style-fit on one lookback and too steep on another.
- An approximately 45-degree slope on the latest price action is treated as the sustainable ideal across holding styles, while a near-vertical path raises the chance of a sudden retracement or stall.
- A late breakout can leave a vertical swing-trade angle after most of the move has already occurred, and an almost vertical multi-month trendline is treated as a high-risk longer hold.
Angle of ascent is not a trendline
Angle of ascent is the slope of the most recent price path on a chart scaled to a chosen holding style. It is used to judge whether a rise or decline looks sustainable before entry.
It is distinct from a trendline. A trendline is treated as valid only after it has been confirmed by at least three touches of price.
Scale the chart to the intended hold
The same stock can show a moderate, style-fit slope on one lookback and a too-steep slope on another. Chart interval and history length must match the intended hold before the angle is judged.
Chart scale is the combination of lookback window, bar interval, and time-to-price aspect, used so slope is not distorted by a compressed or stretched chart.
Style-fit is whether the current slope matches the intended holding period. A steep short-term rise can be acceptable for a brief swing and still be unsuitable for a multi-month hold.
A moderate slope versus a near-vertical path
Across holding styles, the archive treats an approximately 45-degree slope on the latest price action as the sustainable ideal. A near-vertical path raises the chance of a sudden retracement or stall.
Swing trading in this workflow studies several months of daily price action and prefers moderate, sustainable slopes rather than near-vertical runs.
Late breakouts and vertical longer holds
A breakout is a move out of a prior platform or consolidation. A late breakout from a prior platform can leave a vertical swing-trade angle after most of the move has already occurred, which the archive reads as higher retracement risk than an earlier entry.
A near-lateral consolidation slope can be framed as a lower-risk swing entry. An almost vertical multi-month trendline is treated as a high-risk longer hold because velocity is already extreme.
LMIA daily share price into the June 2007 vertical breakout
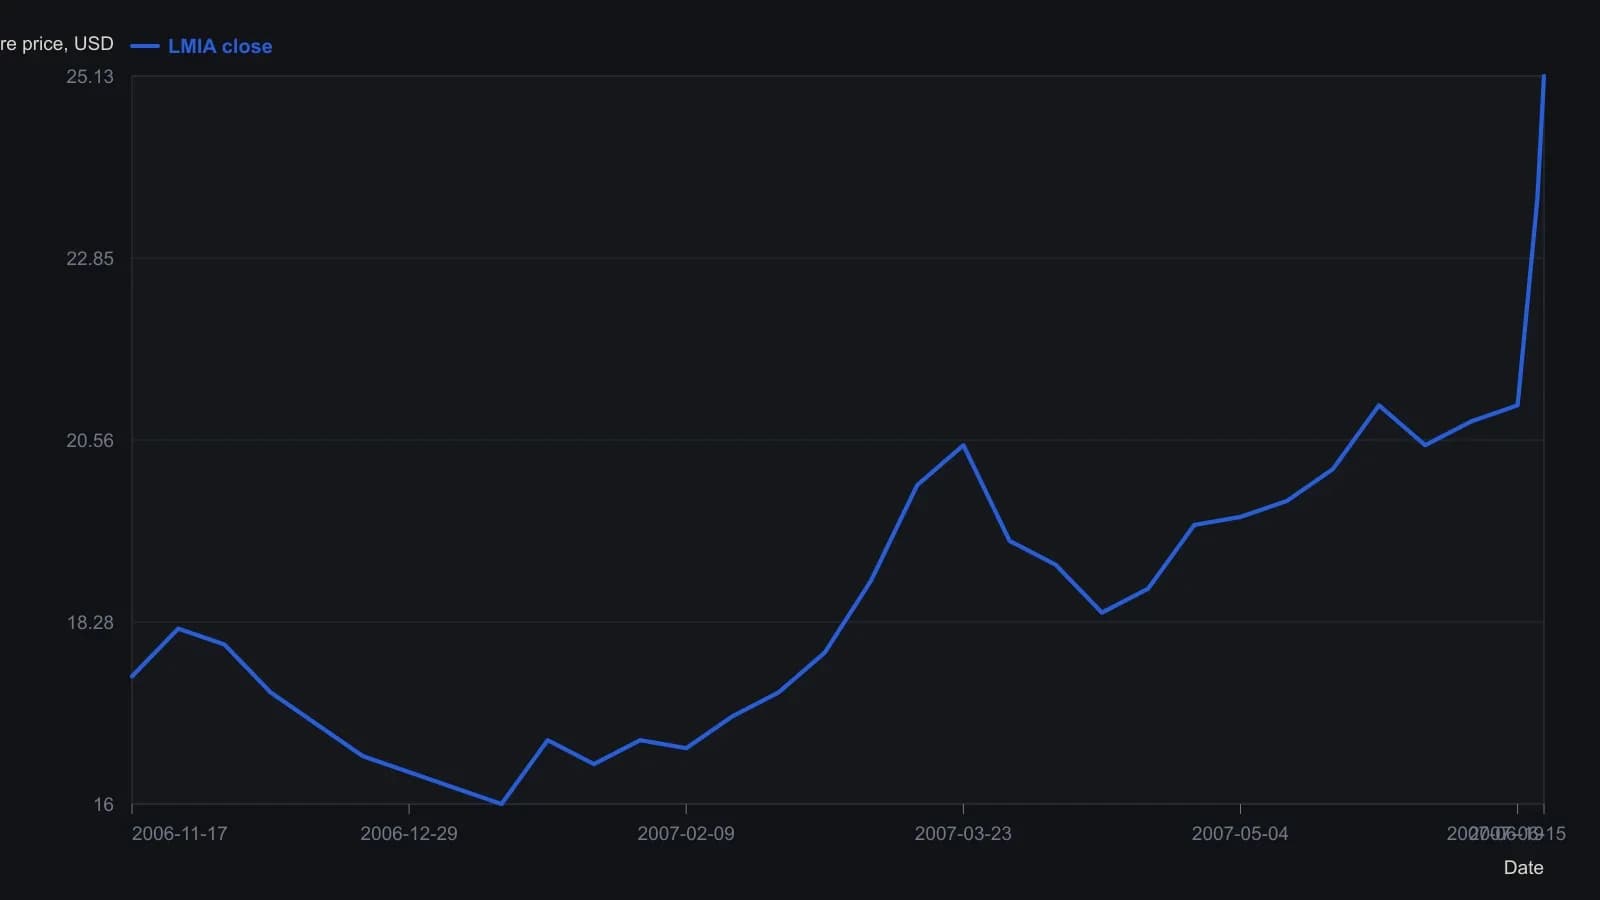
The source pane uses widening price ticks (log-style scaling) and marks the final rise with a short steep segment. Weekly closes are visual readings and are approximate; only the 19 June 2007 close of 25.13 is printed on the quote bar.
All readings on this track · 35 readings
- 2001Swing trading with trailing stops and fixed loss exits
- 2003Linear regression swing alerts and trailing stops
- 2005Range-width gates for swing entries at base edges
- 2006Beyond setups: a six-factor trading process
- 2007Angle of ascent, chart scale, and style-fit
- 2010Stacking a short-horizon oscillator with a moving average and swing hold rules
- 2010A weekly contest long treated as one swing procedure
- 2011Four-color volume-price states for long-only swing actions
- 2012Classify momentum, velocity, or volatility before the swing signal
- 2013Swing rules as a portable entry and exit procedure
- 2013Constructing paired percent-b and stochastic swing oscillators
- 2013Give the fast band line and the slow stochastic complementary jobs
- 2013Smoothed percent-b divergences for numbered swing-wave rules
- 2013Portable swing rules for candle turns and a 1-2-3 wave count
- 2013A three-average swing and breakout case study
- 2013Constructing swing trades with a fifty-day average and a five-bar exponential average
- 2014From aliasing and dilation to a roofed stochastic swing
- 2014Channel width and trend-filter lookback as separate swing-trading choices
- 2016Constructing volume-confirmed multiday breakout swings
- 2017Constructing swing signals from a volume-weighted average cross
- 2017Golden-cross swing entry with a trailing-stop exit
- 2017One swing procedure: group leadership first, then a volume-price leave
- 2017Four-day green-candle breakout entry as one swing procedure
- 2017Swing pivots need a 100-period crossover and a breakout candle
- 2017Supply and demand zones as bounded swing maps
- 2018Three-bar volume-confirmed swing breakout
- 2018Tight stops first on swing breakouts with a range filter
- 2018Constructing trend and swing rules from horizon to crossover
- 2019Decade-level breakouts as one closed swing procedure
- 2019Inverse-pair swing trading with a shared buy-stop
- 2019Week-range next-day breakout on bitcoin pairs
- 2019Ranking strength before confirming a multi-timeframe breakout
- 2019Forty-five-degree multi-week swing breakout as a closed procedure
- 2020A dual pending-stop pair as one bitcoin swing construction
- 2020High-low activator, directional oscillator, and momentum swing agreement