2000issue C121-7
Phasor displays for dominant-cycle construction
A Hilbert transform converts a rotating phasor into inphase and quadrature components so a two-axis track can show when a single dominant cycle still holds and when leftover components warp the path. Entry rules then key off defined inphase axis crossings.
- Build the display from phasor length and phase angle as two orthogonal series, the inphase and quadrature components extracted by a Hilbert transform.
- A clean clockwise rotation supports one dominant cycle; uneven sample spacing flags a frequency change, and radius changes usually indicate a second cycle.
- Shorter leftovers appear as incomplete loops near the origin and longer leftovers pull the trajectory off center, without an extra filter that would add lag.
- Sell when the inphase component is at a maximum and buy when it is at a minimum, after allowing for the lag inherited from the Hilbert computation.
What a phasor records
A cycle can be constructed as a rotating phasor. When the tip is recorded at a uniform sampling rate, it traces a sinewave, and the angle uniquely locates the current position in that waveform.
How the Hilbert pair is built
The display is built by converting phasor length and phase angle into two orthogonal series, the inphase and quadrature components. A Hilbert transform extracts that pair from an analytic waveform.
The inphase component is the horizontal Hilbert output. The quadrature component is the vertical Hilbert output, offset by a quarter cycle from the inphase series so the pair can draw a rotating trajectory.
Reading a single-cycle path
On a perfect single-cycle path the track rotates clockwise. Period can be estimated by counting samples in one quadrant and multiplying by four. Uneven spacing flags a frequency change. Radius changes usually indicate a second cycle.
Leftover components as path distortions
The phasor is drawn as if only the dominant cycle is present, so subordinate components appear as path distortions. Shorter leftovers show as incomplete loops near the origin. Longer leftovers produce an off-center trajectory. Those leftovers are read from the path itself, without an extra filter that would add lag.
When the path enters trend mode
When the dominant-cycle phase stops advancing, the same plot identifies a shift into trend mode. In the illustrated bond example that shift occurred about 17 bars before the end of the sample around point 24.
In trend mode the trajectory no longer completes a regular rotation, and trend-following takes precedence over cycle entries.
March 1996 T-bond futures daily closes
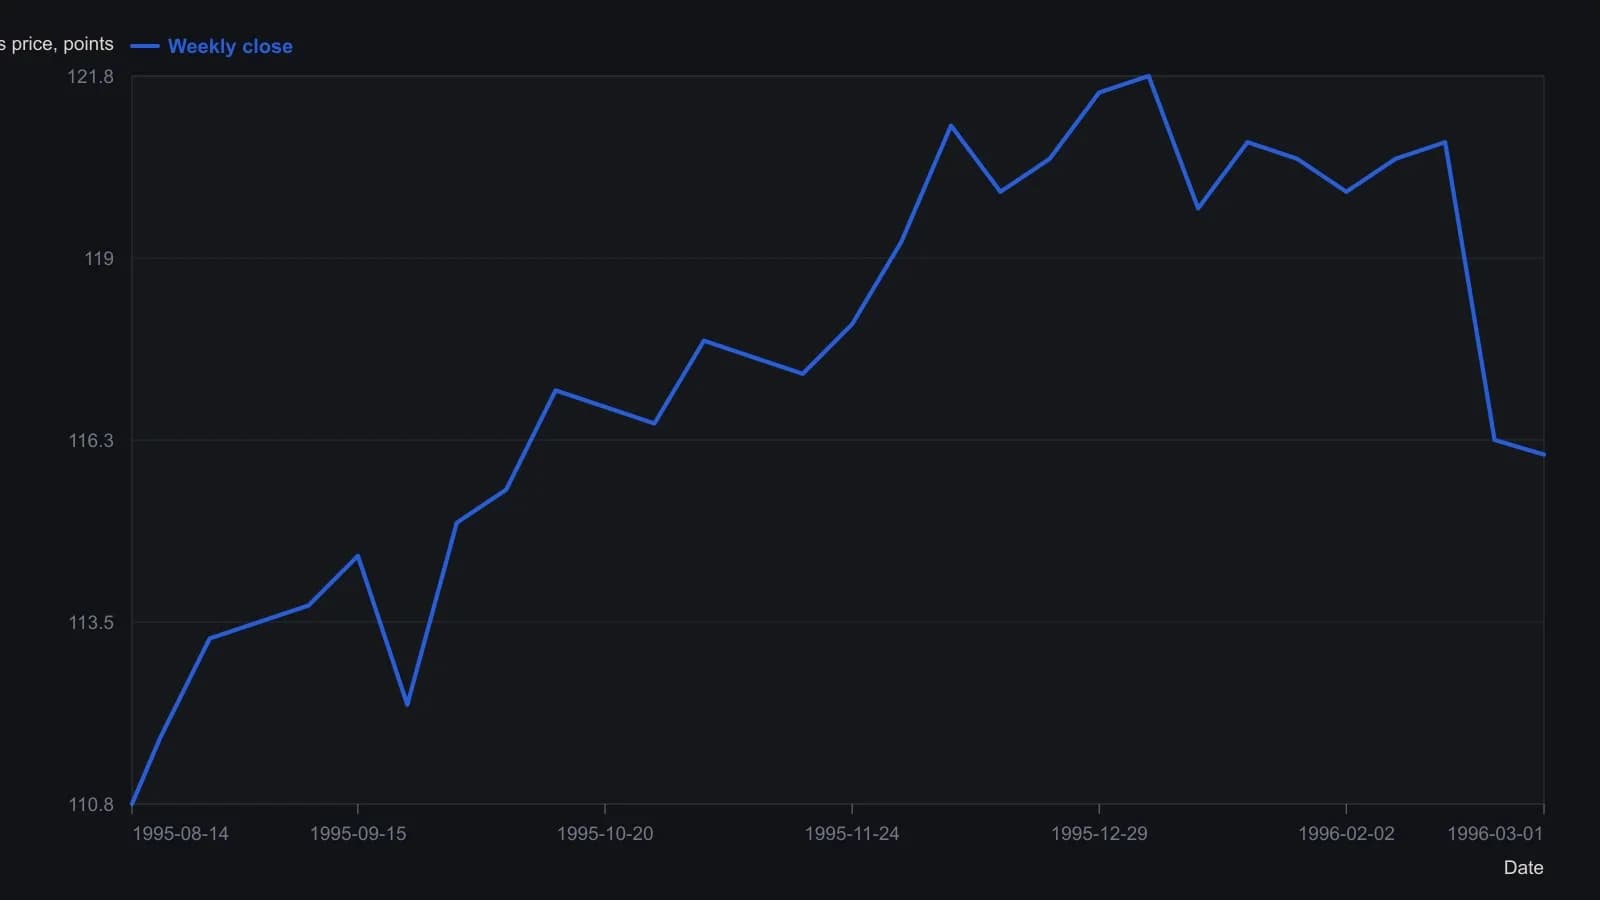
Digitized from the candlestick raster at weekly Friday samples; quarter-point resolution matches the one-point grid. The 1 March 1996 close is the header print, not a visual estimate. Yellow shading on this frame covers September through early November 1995.
Quadrant crossings as entry rules
A rule-based entry sells when the inphase component is at a maximum, the phasor crossing from quadrant I to IV. It buys when the inphase component is at a minimum, the crossing from quadrant III to II.
Lag inherited by those rules
Those entry rules inherit computation lag: a one-bar lag from a four-bar weighted moving average, a three-bar lag from detrending at the filter center, and a three-bar lag from the final inphase calculation.
All readings on this track · 28 readings
- 1984Constructing maximum-entropy spectra for dominant-cycle forecasts
- 1984How to construct a maximum-entropy cycle model
- 1984Constructing a maximum-entropy forecast from a chosen lookback
- 1985Constructing period-locked half-cycle and full-cycle averages
- 1986Why Fourier windows limit dominant-cycle resolution
- 1987Assembling short-lookback maximum-entropy cycle forecasts
- 1988Why a fitted dominant cycle is not a forecast
- 1989Evaluating commodity cycle personalities with spectral histograms
- 1989Evaluating next-session cycle forecasts with stops
- 1989Constructing cycle-aged volatility trailing stops
- 1990A channel signal-to-noise gate for dominant-cycle forecasts
- 1990Year-over-year dominant cycle personality audit
- 1991Cyclic entry from a locked dominant-cycle phase
- 1992Stationarity states on synchronized futures spectral contours
- 1997Hidden horizon assumptions in dominant-cycle readings
- 1997When market cycles are absent more than present
- 1997A spectral estimator that retunes indicators to the measured cycle
- 2000Constructing a Hilbert dominant cycle and a maximum-entropy refinement
- 2000Switch trend and cycle indicators after a half-cycle dwell test
- 2000Constructing a dominant-cycle squelch trend filter
- 2000Phasor displays for dominant-cycle construction
- 2002Low-lag trendline from elliptic and dominant-cycle notches
- 2004Spectral peaks are mode diagnostics, not forecasts
- 2004Compressive last-stage oscillator construction
- 2013Constructing trend failure curves from qualified-trend transitions
- 2014Lookback range, a two-lag smoother, and next-bar fills
- 2014Constructing a MESA stochastic with roofing and SuperSmoother filters
- 2016Constructing spectral heatmaps for dominant market cycles