1991issue C011-9
Set the first stop from a capital-scaled MAE histogram
Harsh, zero-sum settings are treated as a reason to shrink the largest single loss first. Fully specify entry and exit, record maximum adverse excursion on a long enough live sample, bin those open losses by a small capital fraction, and leave the chosen cutoff in force as a stop-loss and trailing stop through the position.
- Harsh, zero-sum market settings are treated as a reason to minimize the largest single loss before seeking other edges.
- Per-position exposure is specified as a small capital fraction, preferably 2% or less, typically near 3% in serious practice and not above 5%. Allocating 10-15% of capital to each position is described as producing a high probability of ruin on a horizon as short as about three months.
- After a complete, judgment-free rule set defines the trade horizon, MAE frequencies are binned in ranges of about 1% of capital. Winning-trade MAE clusters in the first one or two buckets while losing-trade MAE is smeared, which is the basis for a stop that keeps most winners.
- A minimax cutoff is confirmed on a companion profit-and-loss chart, retested on the same history, and left in force as a stop-loss and trailing stop so large winners survive, large losses are truncated, and exposure stays inside the chosen capital fraction.
Minimize the largest single loss first
Harsh, zero-sum market settings are treated as a reason to minimize the size of the largest single loss before seeking other edges. The bound is read from how far complete trades already moved against the position, scaled to a chosen share of equity.
Specify a small capital fraction
Per-position exposure is specified as a small share of capital, preferably 2% or less. Serious practice is described as typically near 3% and not above 5%. Allocating 10-15% of capital to each position is described as producing a high probability of ruin on a horizon as short as about three months.
The capital fraction is the share of account equity assigned to one trade. It converts a dollar loss limit into point or tick buckets on the MAE chart.
Define the trade horizon before measuring loss
Entry and exit must be fully specified with no discretionary overrides so the trade horizon is defined before any loss measurement begins. Maximum adverse excursion is measured only inside that window.
Record maximum adverse excursion
Maximum adverse excursion is the largest open move against a long or short before the trade is closed. It is recorded after running the complete rules on live data for at least 60 and preferably 100 trades, and it is tabulated separately for winners and losers so a capital-scaled cutoff can be read from the two distributions.
Bin open losses by a share of capital
MAE frequencies are binned in ranges of about 1% of capital. A 30000-unit account with 600 units of risk on a 25-unit-per-point contract yields 12-point buckets, first 0-12, then 13-24.
Read the minimax cutoff from the two distributions
Winning-trade MAE is described as clustering in the first one or two buckets, while losing-trade MAE is described as smeared across the axis. That contrast is the basis for a stop that keeps most winners.
The minimax cutoff is the MAE level where winning trades still cluster while the long tail of large losers can be truncated. A companion chart of profit and loss by MAE range is used to confirm the cutoff. The illustrated case treats 12 points of adverse movement as a limit that still captures most winning trades.
Hold the bound through the position
After a cutoff is chosen it is retested on the same history, then left in force through the position so large winners survive, large losses are truncated, and exposure stays inside the chosen capital fraction.
The stop-loss is a precommitted exit placed at the MAE cutoff so a single position cannot consume more than the chosen fraction of equity. The trailing stop is the same MAE-derived bound kept in force for the life of the position, so later adverse movement is still capped after entry.
Apply the same tabulation to other structures
The same MAE tabulation is applied to distance beyond a trend proxy and to travel outside a range. A separate MAE study is used if a reverse is taken after the original stop is hit.
Treasury-bill P&L by MAE point range
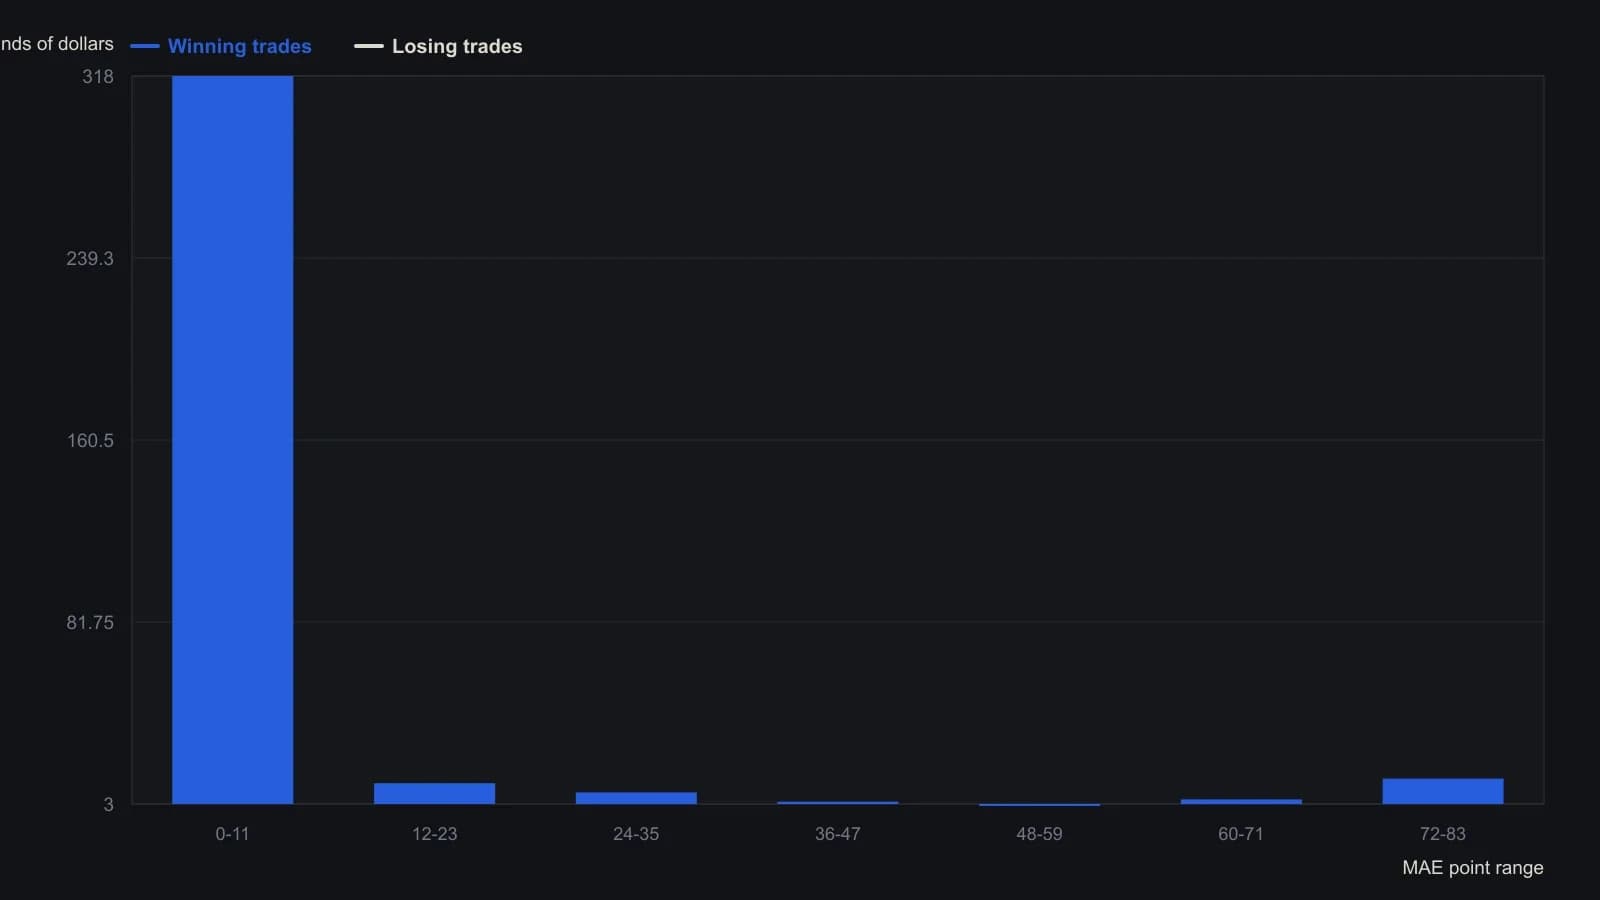
Source bins MAE in 12-point steps so each step is about 1% of a $30,000 account in T-bills at $25 per point. Heights are approximate raster readings, not a published table.
All readings on this track · 15 readings
- 1987Evaluating a black-box pyramiding routine with adverse excursion
- 1991Set the first stop from a capital-scaled MAE histogram
- 1991Opening gap fades bounded by excursion and time stops
- 1991Stop bounds versus added system parameters
- 1991Bound losses with MAE, stops, and drawdown limits
- 1992Multi-year evaluation of MAE-bounded mechanical rules
- 1992Moving-average add-ons could not be separated by maximum adverse excursion
- 1992Evaluating maximum-adverse-excursion stop reversals with short time stops
- 1992Failed range trades as breakout-system tests
- 1998Fitted moving averages for trend add-on entries
- 1998Monthly changer rules specified as one mechanical procedure
- 2002An excursion cutoff test for stops and profit exits
- 2006Constructing peak-excursion filters for stops and size
- 2006Cost-aware excursion filters for stops and holding period
- 2017Staged stops, drawdown limits, and mechanical risk survival