2008issue C111-5
Completed chart patterns as reward-to-risk arithmetic
Completed flags, pennants, and triangles become a measured target and a planned loss. Two 2008 Apple examples show how that arithmetic can accept or reject a setup before entry.
- Risk is defined first as a maximum acceptable loss so a planned profit can be compared with that loss before a trade is taken or rejected.
- A pattern is treated as having an edge only after it completes; unfinished structures are not used as entries.
- A commonly cited 3-to-1 reward-to-risk guideline is a useful default, not a universal rule, because styles and time frames differ.
- Tighter triangle stops at the apex or a nearby close can lift the reward-to-risk ratio but also raise the chance of being stopped out by ordinary noise.
Measure the completed structure first
TradersWeek editorial view: treat a completed flag, pennant, or triangle as pre-trade arithmetic. Measure the structure, size the stop, and accept the setup only when the implied payoff clears a personal reward-to-risk bar.
Risk is defined first as a maximum acceptable loss so a planned profit can be compared with that loss before a trade is taken or rejected. The reward-to-risk ratio is the planned gain versus the planned loss, fixed before entry so a trade can be accepted or rejected on arithmetic rather than impulse.
A pattern is treated as having an edge only after it completes. Unfinished structures are not used as entries.
A useful default, not a universal rule
A commonly cited 3-to-1 reward-to-risk guideline is presented as a useful default, not a universal rule, because styles and time frames differ.
Under a 3-to-1 reward-to-risk plan, three losing trades of equal size can be offset by one winning trade that reaches its target, leaving the account at break-even if risk is held constant.
The same skeleton for every triangle
A triangle pattern is a contracting range, ascending, descending, or symmetrical, whose height at the base is added to the breakout to set a target.
Triangle trades use the same skeleton across those forms: enter on a break outside the pattern, place a stop on the opposite side or just inside the breakout line, and set the target by adding the triangle base to the breakout.
In the March 11, 2008 Apple symmetrical-triangle example, a $16.67 base added to a $124.10 breakout implied a $140.86 target against a stop near $119, producing more than 3-to-1 reward versus a $5.10 planned loss.
Tighter triangle stops at the apex or a nearby close can lift the reward-to-risk ratio but also raise the chance of being stopped out by ordinary noise.
Apple March 2008 triangle: measured high, low, entry, stop, and target
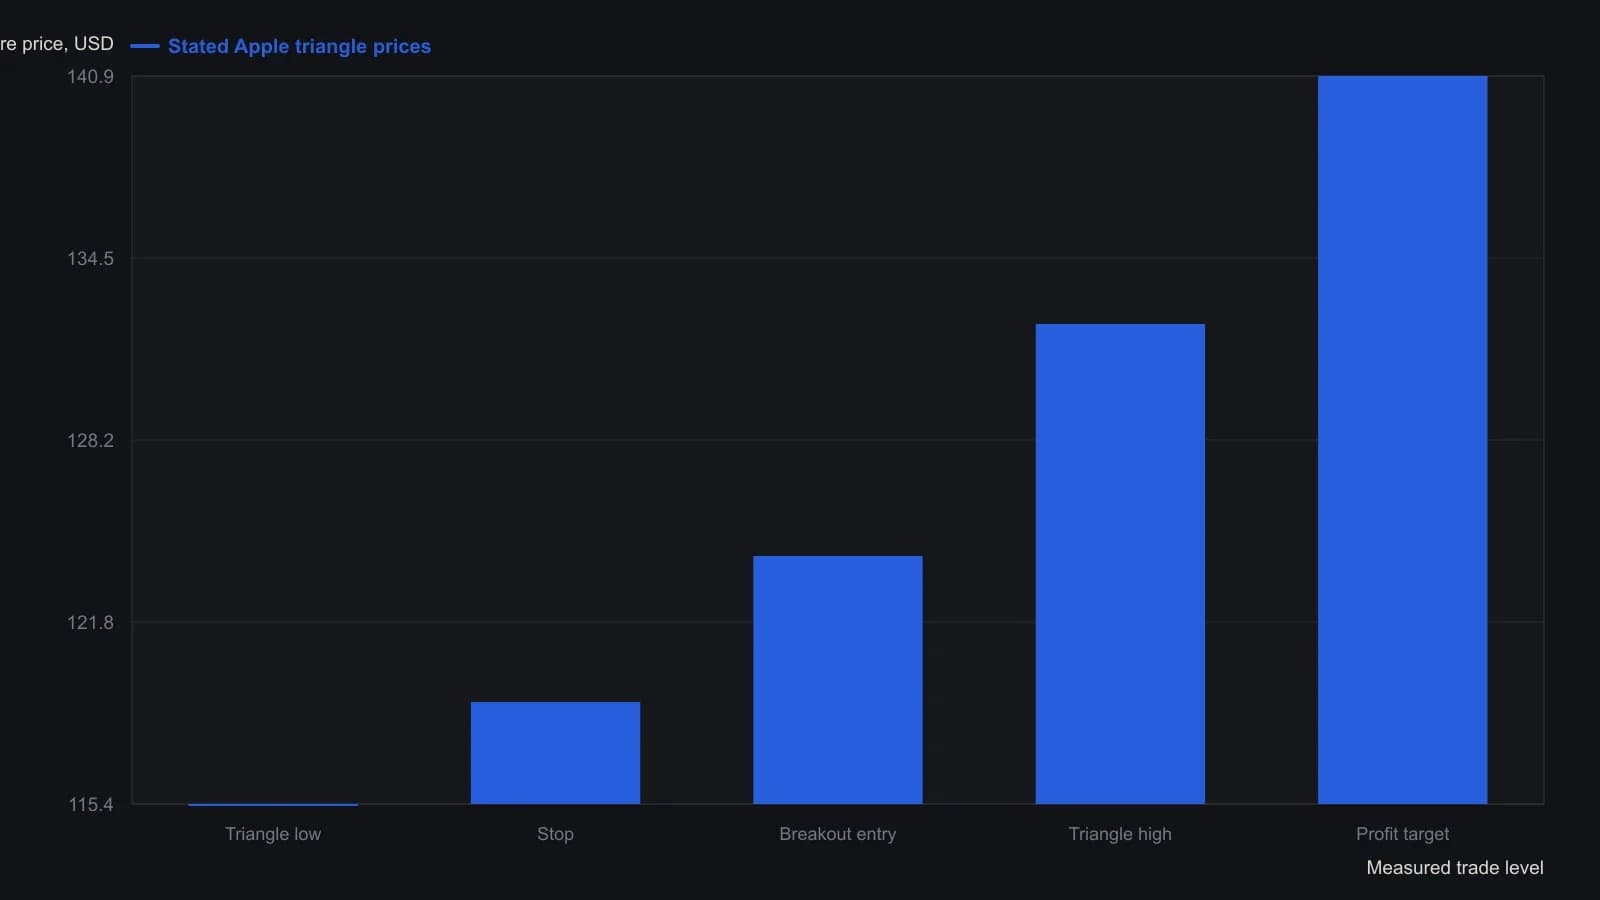
The source lists the triangle high and low as $132.20 and $115.44, yet gives the base as $16.67 and the target as $140.86 ($124.10 plus that base). The stop is given as about $119, which matches the stated $5.10 loss from the $124.10 entry.
Flag and pennant targets from the pole
A flag or pennant is a brief, tight pause after a sharp pole. The pole length becomes the measured target once price breaks the flag or pennant.
After the February 29, 2008 downward break at $135.60, measured objectives near $130.22 or $129.32 were paired with a stop around $137, about $1.40 of risk versus $5.38 or more of planned gain.
After price runs past a target
When price runs past a target, one approach is to scale out, move the stop to the target on what remains, and trail the rest, or to exit into a newly completed pattern that supplies its own measured objective.
All readings on this track · 26 readings
- 1986Constructing bounded relative-strength overlays from oscillator limits
- 1989Point-and-figure fulcrum, count, and flag as three jobs
- 1996The high, tight flag as a three-checkpoint continuation exam
- 2000Test chart patterns with confirmation, not names
- 2001Failed chart patterns as reverse breakout signals
- 2002Ascending triangle and flag: a three-checkpoint QQQ case study
- 2002Two-stage chart reading after breakouts
- 2002The second pattern after a breakout
- 2003Building flags, pennants, and triangles as continuation pauses
- 2003When trendline channels age into a wedge or a break
- 2004Bearish chart patterns need confirmation before the turn
- 2004Constructing flags, pennants, and triangles from swing pivots
- 2005Constructing flag and pennant rules from pole to exit
- 2005Fanline construction for testing trend health
- 2005When flag-and-pennant breakout scans fail a measurement audit
- 2006Testing a bear-flag target after the pause is confirmed
- 2007Homebuilder rebound as a bear-flag, trendline, and volume case study
- 2008Completed chart patterns as reward-to-risk arithmetic
- 2012Reading this file
- 2012Reading regime change: when to stop trading
- 2014Intraday flag construction with breakout and stop rules
- 2015Lock lookback and chart scale before you mark a flag or pennant
- 2017Constructing delayed buy-stops on bull flags and pennants
- 2018Copy an ABC swing as a ruler, then test flags and Fibonacci degree
- 2019Failed flags, pennants, and triangles as a completed experiment
- 2020Confirming candlestick and flag signals on a weekly chart