2006issue C051-8
Testing a bear-flag target after the pause is confirmed
The archive treated a bear flag or pennant as a short pause after a steep drop. After a close through the lower boundary, a later measuring estimate that used historical volatility was presented as closer than a textbook pole projection, while remaining only an estimate.
- A bear flag or pennant was recorded as a short consolidation after a steep drop, with a slanted rectangle or a converging triangle that paused the decline.
- A close through the lower boundary of that pause was used to confirm that the decline has resumed.
- Historical volatility, taken as recent realized price variability, was used to scale how far the next decline is likely to travel.
- A later measuring estimate drawn from the recorded observations was presented as more accurate than a textbook pole projection, while remaining only an estimate.
What the archive recorded
The archive studied 100 bear flag, pennant, or similar short consolidations from January 2004 through June 2005. Each case required a steep, quick decline into the pattern. Average formation length excluding the pole was eight trading days, with a maximum of 15 trading days, or about three calendar weeks.
How the pause was described
In this workflow, a flag and pennant was a short consolidation after a steep drop, with a slanted rectangle or converging triangle that paused the decline. Bear flags were described as higher highs and higher lows between parallel lines that slope up against the prevailing decline. Pennants were described as short symmetrical triangles with converging upper and lower boundaries.
Pattern identification was treated as subjective. Non-textbook shapes were accepted if the setup was a pause after a sharp move with substantial volume contraction.
Confirming the decline has resumed
A breakout was a close through the lower boundary of that pause, used to confirm the decline has resumed. Recorded observations included pole extremes, the last point before a break of the lower trendline, the first post-flag short-term low, volume trend, market conditions, and historical volatility.
Scaling the next decline
Historical volatility was computed from the standard deviation of one-day log-close changes over a 130-observation window. It was recent realized price variability used to scale how far the next decline is likely to travel. A later measuring formula, derived from those observations, was presented as a more accurate price-objective estimate than earlier textbook-style projections, while remaining only an estimate.
Bear-flag breakdowns versus two measuring rules
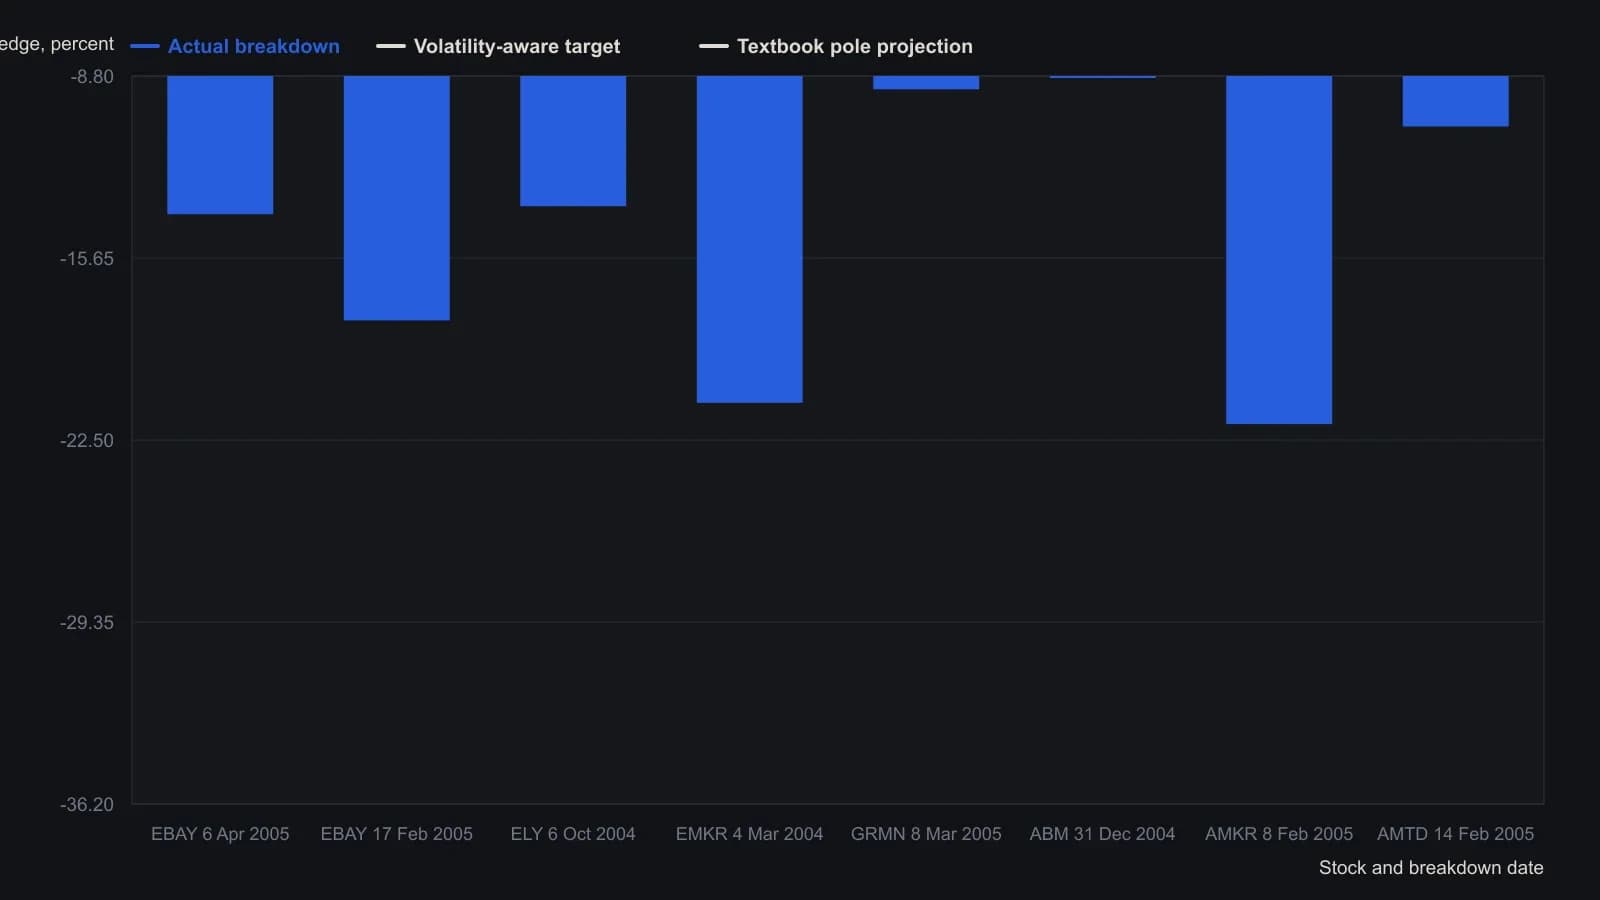
Equation 1 combines pole height, 130-day historical volatility, and flag slope. Katsanos said it slightly underestimates the drop, which he treated as conservative for covering shorts. These eight rows are the printed sample, not the full 100-pattern study.
All readings on this track · 26 readings
- 1986Constructing bounded relative-strength overlays from oscillator limits
- 1989Point-and-figure fulcrum, count, and flag as three jobs
- 1996The high, tight flag as a three-checkpoint continuation exam
- 2000Test chart patterns with confirmation, not names
- 2001Failed chart patterns as reverse breakout signals
- 2002Ascending triangle and flag: a three-checkpoint QQQ case study
- 2002Two-stage chart reading after breakouts
- 2002The second pattern after a breakout
- 2003Building flags, pennants, and triangles as continuation pauses
- 2003When trendline channels age into a wedge or a break
- 2004Bearish chart patterns need confirmation before the turn
- 2004Constructing flags, pennants, and triangles from swing pivots
- 2005Constructing flag and pennant rules from pole to exit
- 2005Fanline construction for testing trend health
- 2005When flag-and-pennant breakout scans fail a measurement audit
- 2006Testing a bear-flag target after the pause is confirmed
- 2007Homebuilder rebound as a bear-flag, trendline, and volume case study
- 2008Completed chart patterns as reward-to-risk arithmetic
- 2012Reading this file
- 2012Reading regime change: when to stop trading
- 2014Intraday flag construction with breakout and stop rules
- 2015Lock lookback and chart scale before you mark a flag or pennant
- 2017Constructing delayed buy-stops on bull flags and pennants
- 2018Copy an ABC swing as a ruler, then test flags and Fibonacci degree
- 2019Failed flags, pennants, and triangles as a completed experiment
- 2020Confirming candlestick and flag signals on a weekly chart