2012issue C1360-63
Reading regime change: when to stop trading
The archive treated a cash-heavy stance as a regime choice, not a gap in activity. When former leaders broke, continuation patterns failed, and volume confirmed the sellers, sitting out was the position.
- Former leadership names that broke and triggered stops ahead of the index were treated as an early warning that the prevailing regime was changing.
- Failed bull flags, pennants, and inverted head-and-shoulders, read with volume-price confirmation, were listed as reasons to stop forcing new buys.
- A gap-filling bounce that then sold off was characterized as a bear-market rally until a new advance was confirmed by steadily expanding volume.
- News fades, Friday and pre-holiday pressure, and first-half-hour gap-up buys were described as more dangerous once the tape was already deteriorating.
Cash as a regime decision
Market regime classification groups market conditions so a single trade is judged against the broader backdrop of leadership, volatility, and portfolio stance rather than in isolation.
The archive described a cash-heavy stance as appropriate when new buys were to be built from a deteriorating tape rather than from a need to trade continuously.
Leadership broke before the index
After a roughly 35% advance in the S&P 500 from the July 2010 low into the May 2, 2011 peak, several former leadership names broke down ahead of the index and triggered stops. That sequence was treated as an early regime warning.
On May 13 the AMEX Securities Broker/Dealer Index fell nearly 5% after displaying a pattern associated with lower prices ahead, adding a sector-leadership warning to the broader tape.
A cluster of broken structures
A breached inverse head-and-shoulders neckline on the S&P 500, a large symmetrical triangle on the brokerage index, and a rounding top on the Russell 2000 were presented together as evidence that the market sat on the edge of a larger decline.
A flag and pennant is a compact continuation pattern that appears after a sharp move. In a healthy uptrend it often resolves higher, but failed flags and pennants can mark a regime shift.
Failed bull flags, pennants, and inverted head-and-shoulders patterns were listed as regime warnings. Pattern-failure, when an expected continuation or reversal structure does not follow through, was itself treated as information about the prevailing regime. A failed continuation setup was also described as usable as a short-side hypothesis if the trade can be entered and exited quickly.
Volume that confirms the sellers
Volume-price analysis reads whether price advances or declines are confirmed by expanding or contracting volume, to judge whether a move has participation or is suspect.
Expanding volume on falling prices is treated as a sign that sellers are increasing. Declining volume on rising prices makes a bounce inside a deteriorating tape suspect until a new advance is confirmed by steadily expanding volume.
When a bounce is only a bear-market rally
A bear-market rally is a sharp but typically short-lived bounce inside a deteriorating tape that can lure dip-buyers before the larger downtrend resumes.
A mid-June bounce that filled a prior gap and then sold off was characterized as a bear-market rally. A subsequent bear channel on the S&P 500 and a large Russell 2000 top were used as confirmation that downside risk had increased.
Volatility, news, and the calendar flip
A sharp rise in option-implied volatility was presented as a reason to stand aside until premiums return toward more typical levels, because elevated volatility makes options more expensive to play.
Regime-dependence is the idea that the same chart setup, news reaction, or weekday tendency can be constructive in one market climate and dangerous in another.
News response is regime-dependent. Deteriorating markets tend to fade good news and often convert morning rallies into end-of-day losses, while advancing markets more often absorb bad news.
Calendar and opening-range habits also flip with regime. In a declining tape, Fridays and pre-holiday sessions were described as especially hard on stocks, and buying a gap-up in the first 30 minutes was treated as riskier until the price holds after that window.
S&P 500 daily: top and the 1177 break
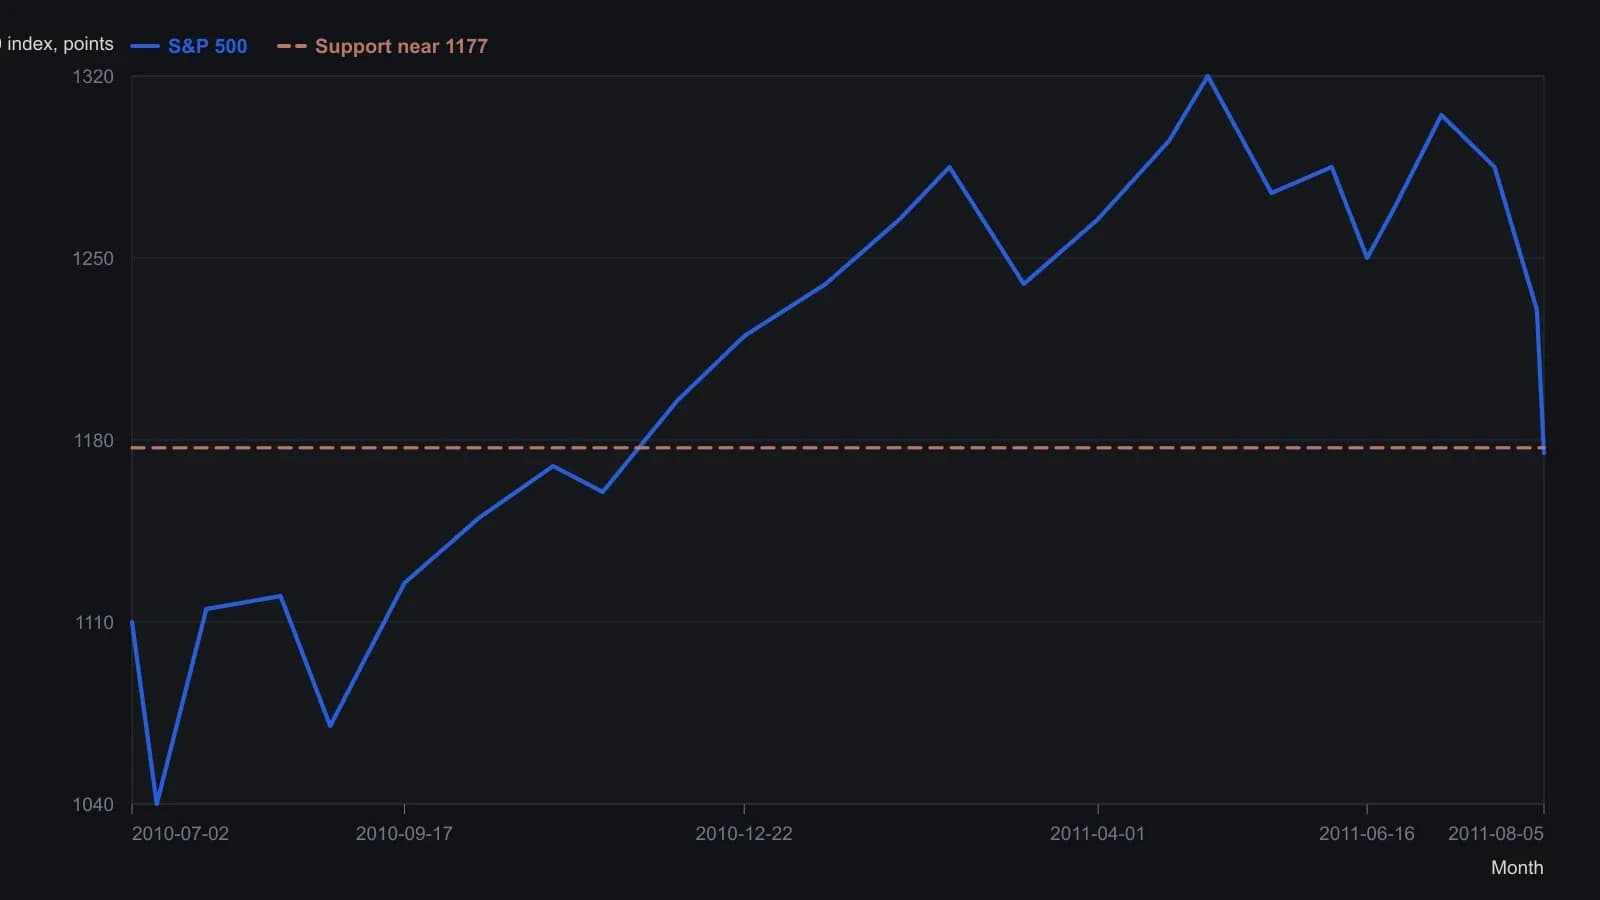
Closes were digitized from the candlestick pane against the source’s 51.2-point printed scale and rounded to the nearest 5 points. The article’s separate 35 percent rally figure from the July 2010 low to 2 May 2011 was not imposed on these points.
All readings on this track · 26 readings
- 1986Constructing bounded relative-strength overlays from oscillator limits
- 1989Point-and-figure fulcrum, count, and flag as three jobs
- 1996The high, tight flag as a three-checkpoint continuation exam
- 2000Test chart patterns with confirmation, not names
- 2001Failed chart patterns as reverse breakout signals
- 2002Ascending triangle and flag: a three-checkpoint QQQ case study
- 2002Two-stage chart reading after breakouts
- 2002The second pattern after a breakout
- 2003Building flags, pennants, and triangles as continuation pauses
- 2003When trendline channels age into a wedge or a break
- 2004Bearish chart patterns need confirmation before the turn
- 2004Constructing flags, pennants, and triangles from swing pivots
- 2005Constructing flag and pennant rules from pole to exit
- 2005Fanline construction for testing trend health
- 2005When flag-and-pennant breakout scans fail a measurement audit
- 2006Testing a bear-flag target after the pause is confirmed
- 2007Homebuilder rebound as a bear-flag, trendline, and volume case study
- 2008Completed chart patterns as reward-to-risk arithmetic
- 2012Reading this file
- 2012Reading regime change: when to stop trading
- 2014Intraday flag construction with breakout and stop rules
- 2015Lock lookback and chart scale before you mark a flag or pennant
- 2017Constructing delayed buy-stops on bull flags and pennants
- 2018Copy an ABC swing as a ruler, then test flags and Fibonacci degree
- 2019Failed flags, pennants, and triangles as a completed experiment
- 2020Confirming candlestick and flag signals on a weekly chart