2004issue C091-2
Constructing flags, pennants, and triangles from swing pivots
Swing-line geometry builds flags, pennants, and triangles by anchoring edges at swing pivots. Construction is ordered from the smallest one-swing flag to three-swing triangles, so the named geometry can be tested and other pattern hypotheses can be set aside.
- Swing-line geometry constructs chart patterns by anchoring edges at swing pivots where price reversed.
- In a trend, construction is ordered from smallest to largest as one-swing flags, two-swing pennants, two-swing flags, two-swing ABC corrections, and three-swing triangles or wedges.
- A two-swing pennant is identified when two overlapping swing pairs show a lower second swing high and a higher second swing low.
- Naming the constructed geometry first excludes other pattern hypotheses before choosing how to position for the remaining possibilities.
Swing pivots as pattern corners
Swing-line geometry is used to construct chart patterns by anchoring pattern edges at swing pivots where price reversed. A swing-line connects successive swing pivots so overlapping swings and pattern boundaries are easier to see.
A swing pivot is a reversal high or low. It anchors a pattern edge and can serve as a candidate support or resistance level. Overlapping swings are paired upswings and downswings that occupy a shared price zone and signal congestion rather than a clean one-way move.
Construction from smallest to largest
In a trend, pattern construction is ordered from smallest to largest as one-swing flags, two-swing pennants, two-swing flags, two-swing ABC corrections, and three-swing triangles or wedges.
One-swing and two-swing flags
A one-swing bull flag is constructed as the first retracement after a breakout, with a typical search constraint of a pullback no longer than four bars. The one-swing flag is the smallest pattern in that sequence: a compact continuation shape whose first pullback is a single swing against the prior impulse.
A two-swing bull flag is constructed when two pairs of swings overlap after a breakout, marking congestion rather than a single clean pullback. The two-swing flag is the larger flag built from those overlapping swings.
Former resistance at a breakout level can be retested as candidate support once price returns above that level after the flag swings.
Two-swing pennants
A pennant is constructed by comparing two overlapping swing pairs and finding a lower second swing high together with a higher second swing low. That contracting continuation shape is a two-swing pennant.
When that contracting geometry appears after an advance out of a multiyear decline, it can be treated as consolidation inside a larger uptrend rather than a new trend change.
Three-swing triangles and wedges
A three-swing overlapping structure can be constructed either as a rising or ascending wedge that sets up a reversal or as a running triangle that precedes continuation. Both belong with the three-swing triangle: a larger consolidating geometry formed from three overlapping swing pairs, including wedges and running triangles.
Name the geometry before positioning
Naming the constructed geometry first is used to exclude other pattern hypotheses before choosing how to position for the remaining possibilities.
Weekly HUI one-swing bull flag into the 214 target
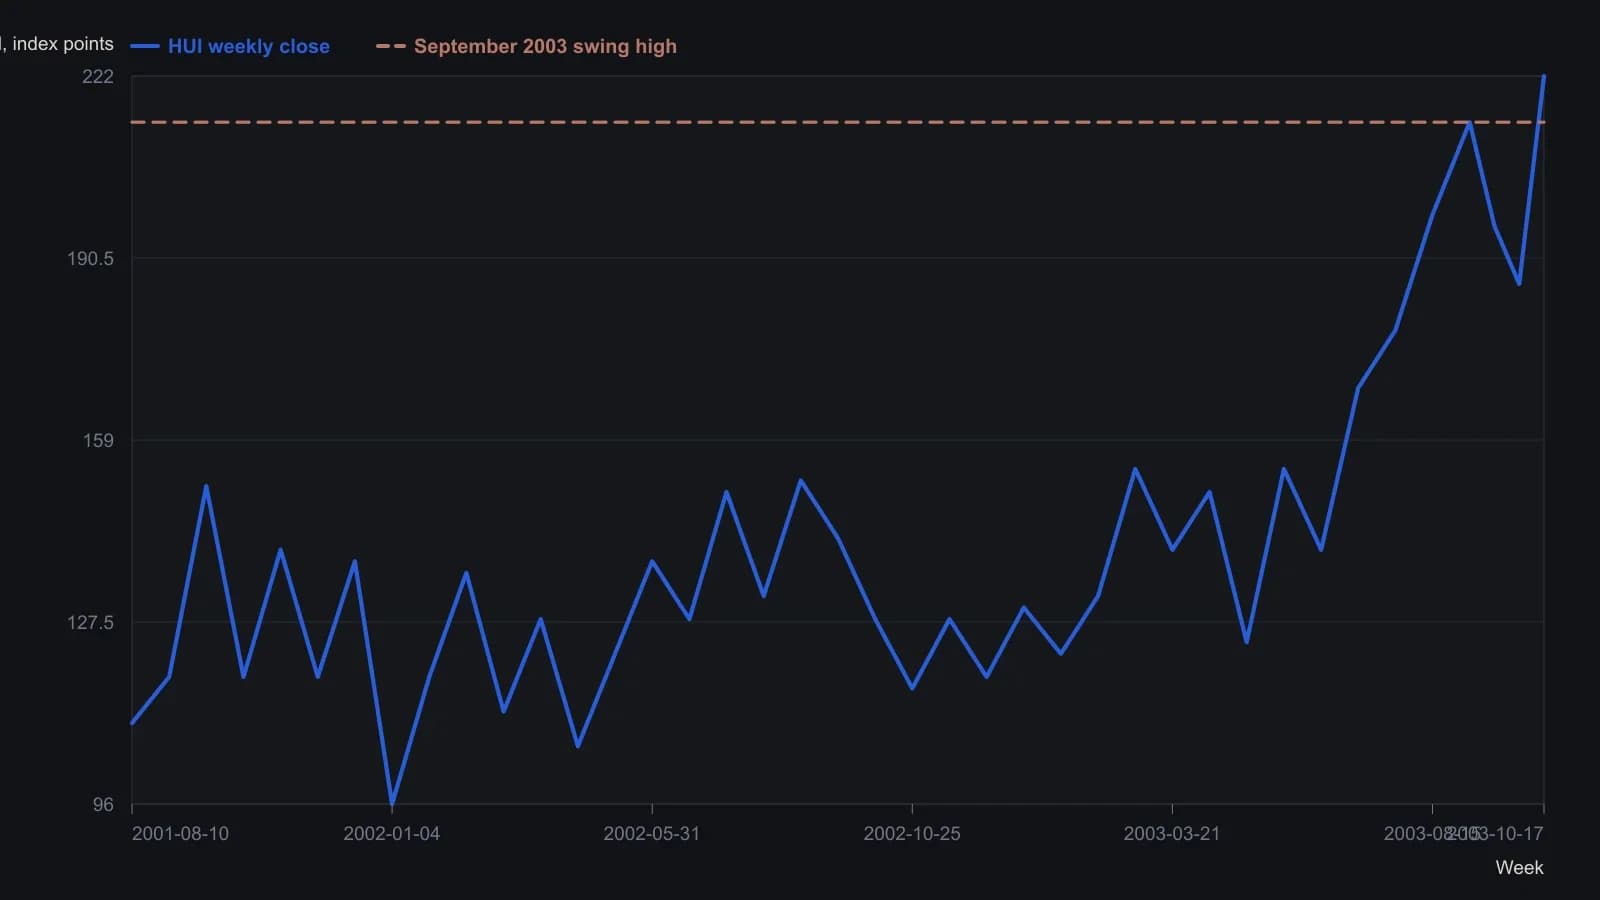
Weekly closes digitized from the IQ Chart raster (about ±3 index points). The 214 threshold is the printed dotted line and the September 2003 swing high named in the sidebar. Green moving-average overlay omitted.
All readings on this track · 26 readings
- 1986Constructing bounded relative-strength overlays from oscillator limits
- 1989Point-and-figure fulcrum, count, and flag as three jobs
- 1996The high, tight flag as a three-checkpoint continuation exam
- 2000Test chart patterns with confirmation, not names
- 2001Failed chart patterns as reverse breakout signals
- 2002Ascending triangle and flag: a three-checkpoint QQQ case study
- 2002Two-stage chart reading after breakouts
- 2002The second pattern after a breakout
- 2003Building flags, pennants, and triangles as continuation pauses
- 2003When trendline channels age into a wedge or a break
- 2004Bearish chart patterns need confirmation before the turn
- 2004Constructing flags, pennants, and triangles from swing pivots
- 2005Constructing flag and pennant rules from pole to exit
- 2005Fanline construction for testing trend health
- 2005When flag-and-pennant breakout scans fail a measurement audit
- 2006Testing a bear-flag target after the pause is confirmed
- 2007Homebuilder rebound as a bear-flag, trendline, and volume case study
- 2008Completed chart patterns as reward-to-risk arithmetic
- 2012Reading this file
- 2012Reading regime change: when to stop trading
- 2014Intraday flag construction with breakout and stop rules
- 2015Lock lookback and chart scale before you mark a flag or pennant
- 2017Constructing delayed buy-stops on bull flags and pennants
- 2018Copy an ABC swing as a ruler, then test flags and Fibonacci degree
- 2019Failed flags, pennants, and triangles as a completed experiment
- 2020Confirming candlestick and flag signals on a weekly chart