2005issue C071-3
When flag-and-pennant breakout scans fail a measurement audit
A flag-and-pennant breakout can look complete in a scan and still fail a measurement audit. Vertical scale, unfinished consolidation, and a target that reprices on every pass can each falsify the same chart condition.
- A 100-flag sample drawn from more than 2,000 charts held only six large-cap names, a few mid-caps, and mostly small-caps, with an average pre-breakout price of 14.
- A logarithmic-scale keeps the pole and the later breakout comparable as percentages. An arithmetic rise from 10 to 20 and then from 20 to 30 looks equal when the pole is twice the breakout.
- Pattern-duration clustered between 4 and 21 days for 90 percent of cases, so 3- or 4-day flags needed a filter shorter than 5 days or a wait-for-breakout rule.
- A scan that recomputes the objective from the current price can print a new target on consecutive days. The pre-breakout-reference, or the lower of two successive targets, was treated as the consistent figure.
Three ways the same chart condition fails
A flag-and-pennant is a brief consolidation after a sharp pole, treated here as a scan condition that still has to survive duration and scale checks. A breakout is a move out of the flag or pennant that supplies the reference for measuring the next leg. The pole is the sharp prior advance used to size the pattern and to compare with that later breakout on a percentage scale.
Editorial view: the same chart condition can be falsified by vertical scale, by an unfinished consolidation, or by a target that reprices every scan. The notes below describe a historical scan-and-measure workflow, not a claim about later results.
The 100-flag sample was mostly small-caps
A flag-and-pennant sample built by screening more than 2,000 charts and keeping 100 flags contained only six large-cap names, a few mid-caps, and mostly small-caps. In that 100-flag sample, the average price before the breakout was 14, with observed extremes of 73 and 0.60.
The same reply treated a float above 10 billion shares as less able to move more than 5 percent in 10 days than a float under 40 million. Historical volatility was used as a related screen when capitalization could not be filtered. A price cap near 50 was offered as a substitute limit.
Read the pole against the breakout on a logarithmic-scale
A logarithmic-scale is a vertical axis that keeps percentage moves comparable so the pole and the breakout are not read as equal when they are not. That scale was recommended so percentage changes in the pole and the later breakout can be compared.
An arithmetic rise from 10 to 20 and then from 20 to 30 looks equal. The log scale shows the pole as twice the breakout.
The published measurement work covered bullish flags only. Bearish use was described as taking the absolute value of the pole so the formula does not go negative. Symmetrical triangles were not part of the study.
Price path of the illustrated flag-and-pennant chart
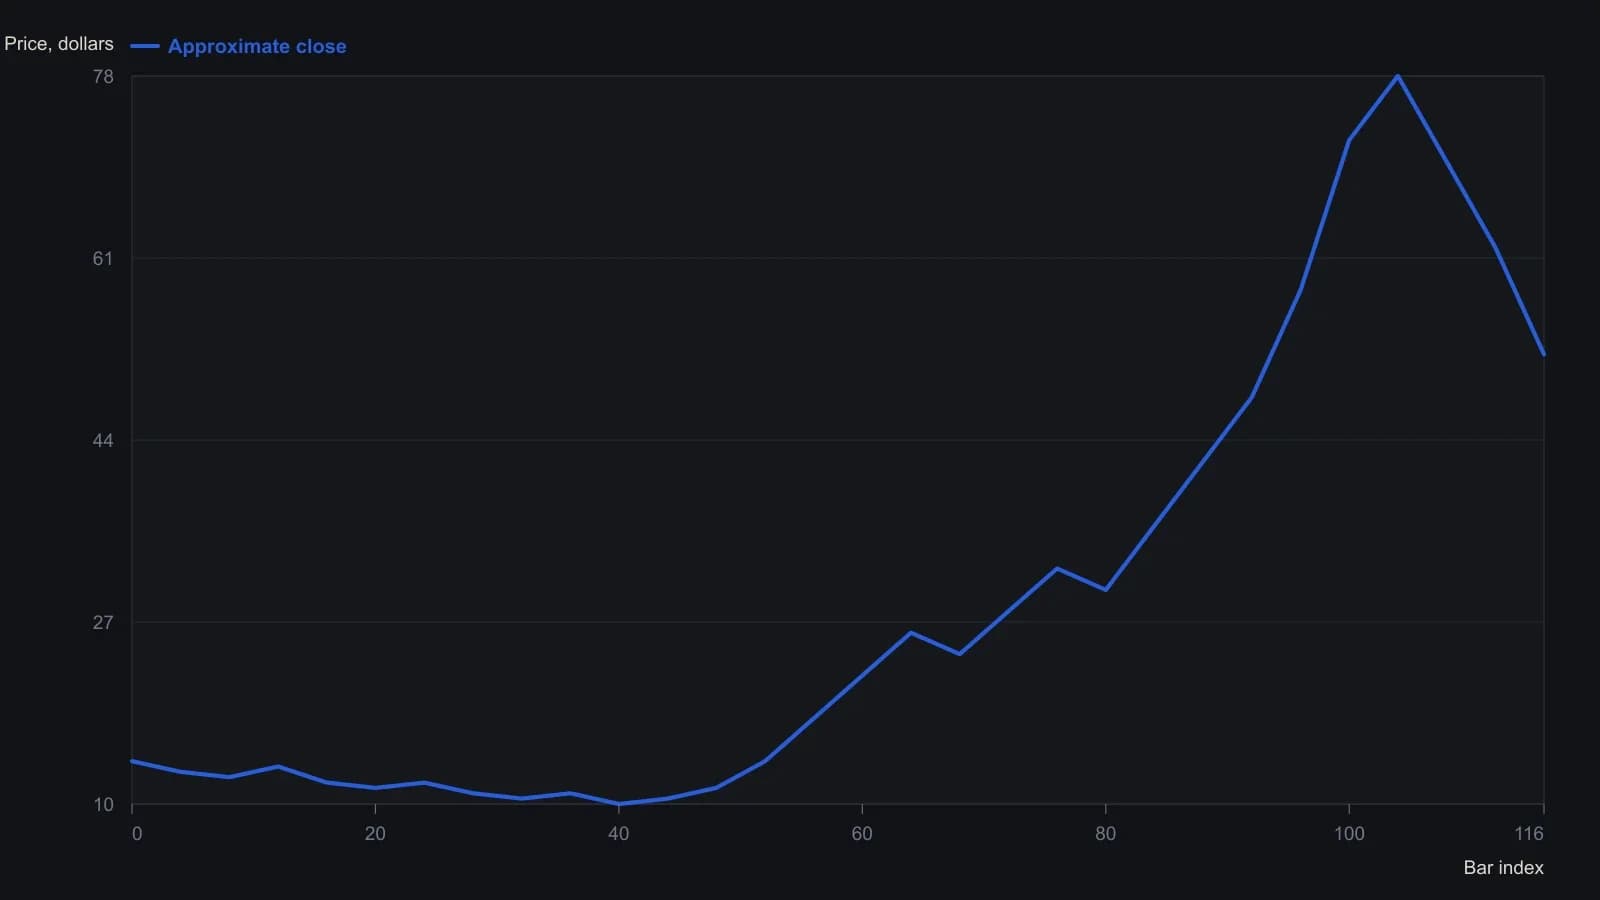
Closes sampled from the raster; left-side bars are too dense to resolve individually, and the printed date stamps are not reliably legible, so the x-axis is bar index rather than calendar dates.
Pattern-duration and a detector that will not sit still
Pattern-duration is how many sessions the consolidation has lasted before a scan is allowed to call it a flag. Reported flag durations clustered between 4 and 21 days for 90 percent of cases, with a median of 9 days. A filter excluding consolidations shorter than 5 days, or a wait-for-breakout rule, was offered for scans that tagged 3- or 4-day flags.
Because a dynamic swing calculation can rewrite earlier turning points, the published detector was intended for scan explorations rather than as a live chart overlay. One illustrated flag printed on three later session dates.
A target that reprices is not the same measurement
A scan that recomputes the objective from the current price can print different targets on consecutive days. The original formula used the pre-breakout-reference, the price frozen before the flag is left, rather than a target recalculated from each new close. The lower of two successive targets was treated as the consistent figure.
A similarly plotted momentum oscillator was compared with MACD and described as belonging to the same visual family, with only calculation differences separating the two. MACD is a two-line momentum comparison that can look interchangeable with nearby oscillators until the calculations are separated.
All readings on this track · 26 readings
- 1986Constructing bounded relative-strength overlays from oscillator limits
- 1989Point-and-figure fulcrum, count, and flag as three jobs
- 1996The high, tight flag as a three-checkpoint continuation exam
- 2000Test chart patterns with confirmation, not names
- 2001Failed chart patterns as reverse breakout signals
- 2002Ascending triangle and flag: a three-checkpoint QQQ case study
- 2002Two-stage chart reading after breakouts
- 2002The second pattern after a breakout
- 2003Building flags, pennants, and triangles as continuation pauses
- 2003When trendline channels age into a wedge or a break
- 2004Bearish chart patterns need confirmation before the turn
- 2004Constructing flags, pennants, and triangles from swing pivots
- 2005Constructing flag and pennant rules from pole to exit
- 2005Fanline construction for testing trend health
- 2005When flag-and-pennant breakout scans fail a measurement audit
- 2006Testing a bear-flag target after the pause is confirmed
- 2007Homebuilder rebound as a bear-flag, trendline, and volume case study
- 2008Completed chart patterns as reward-to-risk arithmetic
- 2012Reading this file
- 2012Reading regime change: when to stop trading
- 2014Intraday flag construction with breakout and stop rules
- 2015Lock lookback and chart scale before you mark a flag or pennant
- 2017Constructing delayed buy-stops on bull flags and pennants
- 2018Copy an ABC swing as a ruler, then test flags and Fibonacci degree
- 2019Failed flags, pennants, and triangles as a completed experiment
- 2020Confirming candlestick and flag signals on a weekly chart