2000issue C091-6
Test chart patterns with confirmation, not names
A named shape is only a sketch. First require a confirming close that can kill the idea, then rank what survives by spacing, neckline tilt, and breakout volume.
- In a five-year daily sample of 1,280 twin-peak structures, 65 percent never closed below the intervening low and were not treated as completed double tops.
- Waiting for that close reduced the double-top failure rate to 17 percent, after which 83 percent of cases continued lower by more than 5 percent.
- After confirmation, closer peaks, deeper troughs, tighter bottom spacing, neckline slope, and high-volume breaks were each associated with larger follow-through.
- Editorial reading: treat flags and head-and-shoulders as hypotheses until the pause or neckline close, then rank the surviving sketch rather than the name.
A name is only a sketch
Two peaks or troughs near the same price become a completed double top or double bottom only after a close through the confirmation point, the extreme between those swings. That close is the test that separates a look-alike sketch from a completed pattern.
A head-and-shoulders structure is a multi-swing reversal sketch with a central extreme and flanking shoulders. It stays hypothetical until price closes through the neckline, the reference line across the intervening swings. A flag or pennant is a brief pause after a sharp thrust, including the high, tight flag, and is a continuation hypothesis rather than a finished signal. The high, tight flag is the compact form of that pause after a very large, fast prior advance, and it is judged on the break from the pause.
Start with a close that can kill the idea
In a five-year daily sample of 1,280 twin-peak structures, 826 cases, or 65 percent, never closed below the intervening low and were therefore not treated as completed double tops.
Waiting for a close below that intervening low reduced the double-top failure rate in the same sample to 17 percent, after which 83 percent of cases continued lower by more than 5 percent.
Then rank the survivors
Among the confirmed double tops, closer peaks, deeper intervening troughs, and high-volume downside breaks were each associated with larger subsequent declines.
Across 542 double bottoms, troughs about three weeks apart were followed by average rises of 42 percent, compared with 23 percent when the troughs were about four months apart.
Editorial: those features are the second gate. They rank a completed idea. They do not replace the confirming close.
A flag is still a pause
Among 35 bullish pattern variations compared in the review, the high, tight flag showed a 63 percent average subsequent rise, versus 38 percent for the bullish set as a whole.
Editorial: a higher average rise in that historical comparison does not make the name a signal. The high, tight flag remains a flag-and-pennant pause until the break from the pause.
Grade the neckline, not the name
Among 32 bearish pattern variations compared in the review, the complex head-and-shoulders top showed a 27 percent average subsequent decline, versus 21 percent for the bearish set as a whole.
Complex head-and-shoulders tops with downsloping necklines showed a 27 percent average decline, compared with 26 percent when the neckline was level.
Complex head-and-shoulders bottoms with a downsloping neckline were associated with larger subsequent rises than those with a rising neckline, and high-volume neckline breaks were linked to larger follow-through.
Editorial: neckline slope is part of the evaluation, not decoration. The first gate remains the close through the neckline.
Cognex weekly price with two consolidations
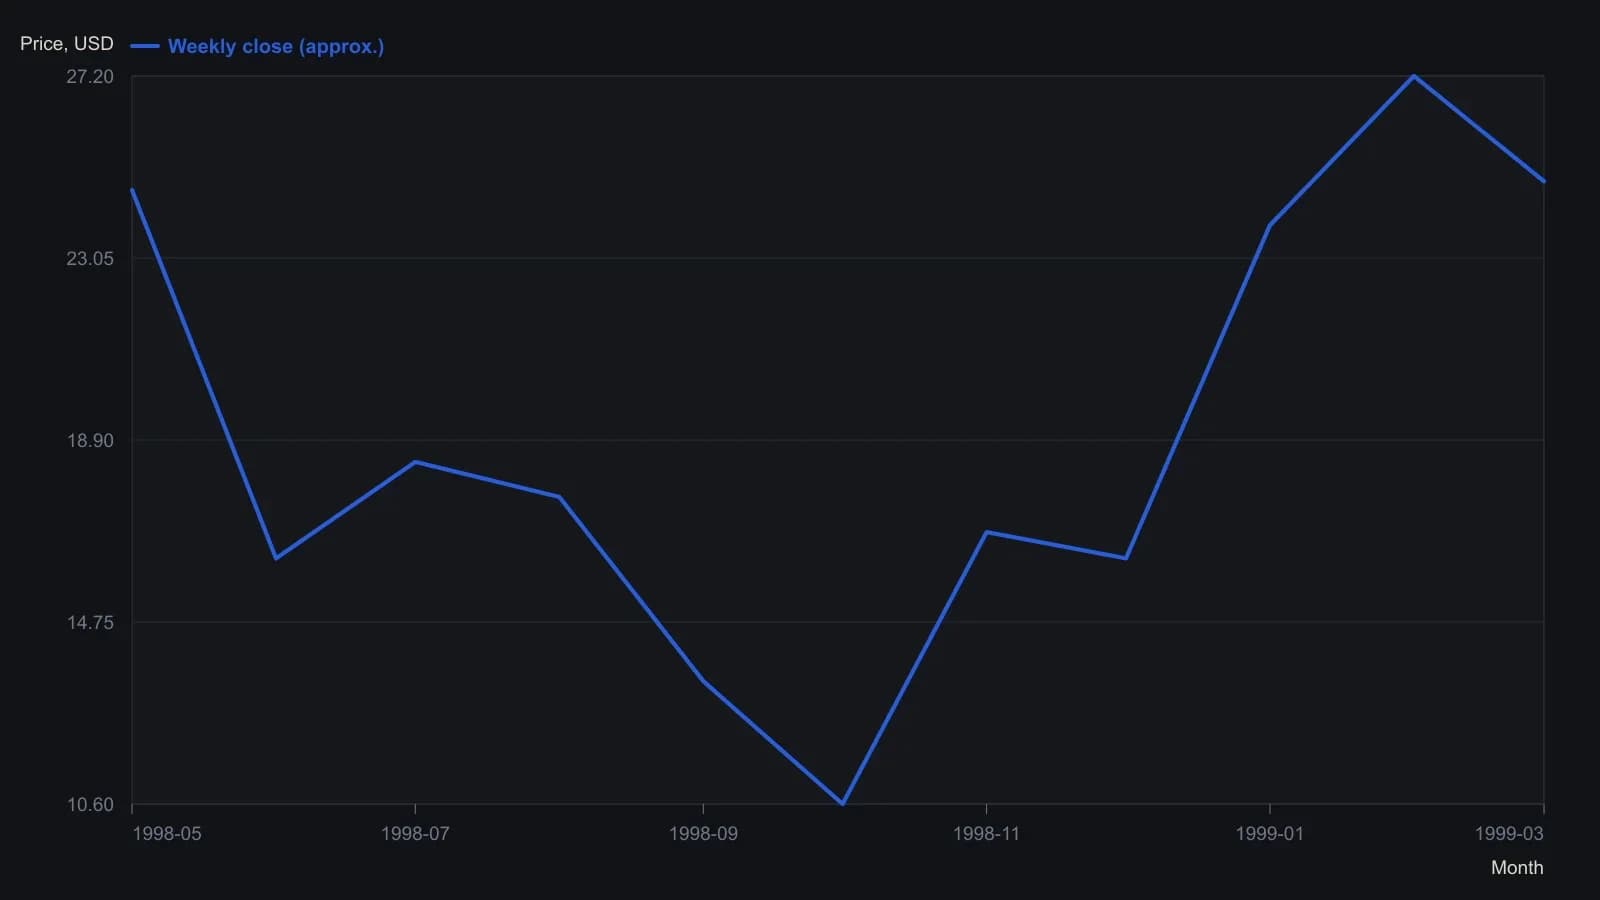
OHLC path digitized from the raster; weekly highs and lows are approximate. Pattern outlines on the source image are annotations, not extra series.
All readings on this track · 26 readings
- 1986Constructing bounded relative-strength overlays from oscillator limits
- 1989Point-and-figure fulcrum, count, and flag as three jobs
- 1996The high, tight flag as a three-checkpoint continuation exam
- 2000Test chart patterns with confirmation, not names
- 2001Failed chart patterns as reverse breakout signals
- 2002Ascending triangle and flag: a three-checkpoint QQQ case study
- 2002Two-stage chart reading after breakouts
- 2002The second pattern after a breakout
- 2003Building flags, pennants, and triangles as continuation pauses
- 2003When trendline channels age into a wedge or a break
- 2004Bearish chart patterns need confirmation before the turn
- 2004Constructing flags, pennants, and triangles from swing pivots
- 2005Constructing flag and pennant rules from pole to exit
- 2005Fanline construction for testing trend health
- 2005When flag-and-pennant breakout scans fail a measurement audit
- 2006Testing a bear-flag target after the pause is confirmed
- 2007Homebuilder rebound as a bear-flag, trendline, and volume case study
- 2008Completed chart patterns as reward-to-risk arithmetic
- 2012Reading this file
- 2012Reading regime change: when to stop trading
- 2014Intraday flag construction with breakout and stop rules
- 2015Lock lookback and chart scale before you mark a flag or pennant
- 2017Constructing delayed buy-stops on bull flags and pennants
- 2018Copy an ABC swing as a ruler, then test flags and Fibonacci degree
- 2019Failed flags, pennants, and triangles as a completed experiment
- 2020Confirming candlestick and flag signals on a weekly chart