2003issue C111-4
When trendline channels age into a wedge or a break
A price channel is a perishable support and resistance hypothesis. Keep the map only while the sides stay nearly parallel, the move is not treated as exhausted, and closes still respect the line. A wedge or a decisive close through the boundary is the hypothesis failing, not a reason to cling to the old trend.
- A price trend is a temporary directional move, and continuation is treated as less likely after a larger percentage change and after a longer elapsed trend.
- A price channel is the band between a trendline through pullback extremes and a roughly parallel counterpart; it maps support and resistance only while those sides remain usable.
- Sides that are not within about 10 degrees of parallel are classified as broadening or wedging pattern channels and are described as more reversal-prone than near-parallel trend channels.
- An uptrend is treated as failed when a close sits about 3% or more below the rising support line, scaled to volatility; that close ends the hypothesis, even though uncommon false failures can pierce, re-enter, and then resume.
A channel is a perishable hypothesis
A price trend is a directional move over time. In the archive workflow, every such move is temporary, and when it ends it often reverses.
Continuation is treated as less likely after a larger percentage change and after a longer elapsed trend.
The editorial reading is that a price channel is therefore a perishable support and resistance hypothesis. Keep it only while the sides stay nearly parallel, the move is not treated as exhausted, and closes still respect the line.
How the channel is drawn
Trendline analysis marks pullbacks against the main direction. A trendline is a straight boundary fitted through successive pullback extremes so the prevailing direction can be tested rather than assumed. In an uptrend, the rising support line connects those pullback lows.
A second line drawn parallel through the opposite extremes forms a price channel. The band between the two lines acts as support and resistance, and the vertical distance between them is the channel's price range.
A channel side that rests on only one pullback is treated as less reliable than a side defined by two pullbacks.
When the sides are no longer a trend channel
Channel sides that are not within about 10 degrees of parallel are classified as broadening or wedging pattern channels. They are described as more reversal-prone than near-parallel trend channels.
In editorial terms, a short non-parallel interruption, including a contracting wedge, is a flag and pennant style pattern channel rather than a stable trend channel. Treat the change of shape as the original hypothesis failing, not as a reason to keep the old trend.
On the illustrated index in the archive, an upward wedge between two rising lines was read as bearish. Two rising resistance lines intersecting near 32 coincided with volume above 150 million shares and a later $2, or 6.4%, decline.
When a close ends the map
An uptrend is treated as failed when a close sits about 3% or more below the rising support line. The exact percentage is scaled to the instrument's volatility. That close is a trendline failure: evidence that the prior direction has ended.
False failures occur when price pierces a line, re-enters the channel, and then resumes the prior direction. They are described as uncommon but real.
The editorial implication is the same at either boundary. A decisive close through the line is the hypothesis failing. It is not a reason to cling to the prior channel.
More than one trend can share the window
More than one trend can operate in the same window because mixed sentiment produces uneven pullbacks. Those overlapping trends show up as concurrent lines of different slope or span.
A six-month index example in the archive showed a well-defined inner $3 channel of about 21 weeks nested inside a larger $5 channel of about 26 weeks.
In editorial terms, the inner and outer maps are separate hypotheses. Each is kept only while its own sides stay nearly parallel and its own closes still respect the line.
QQQ from the October 2002 low into the mid-2003 squeeze
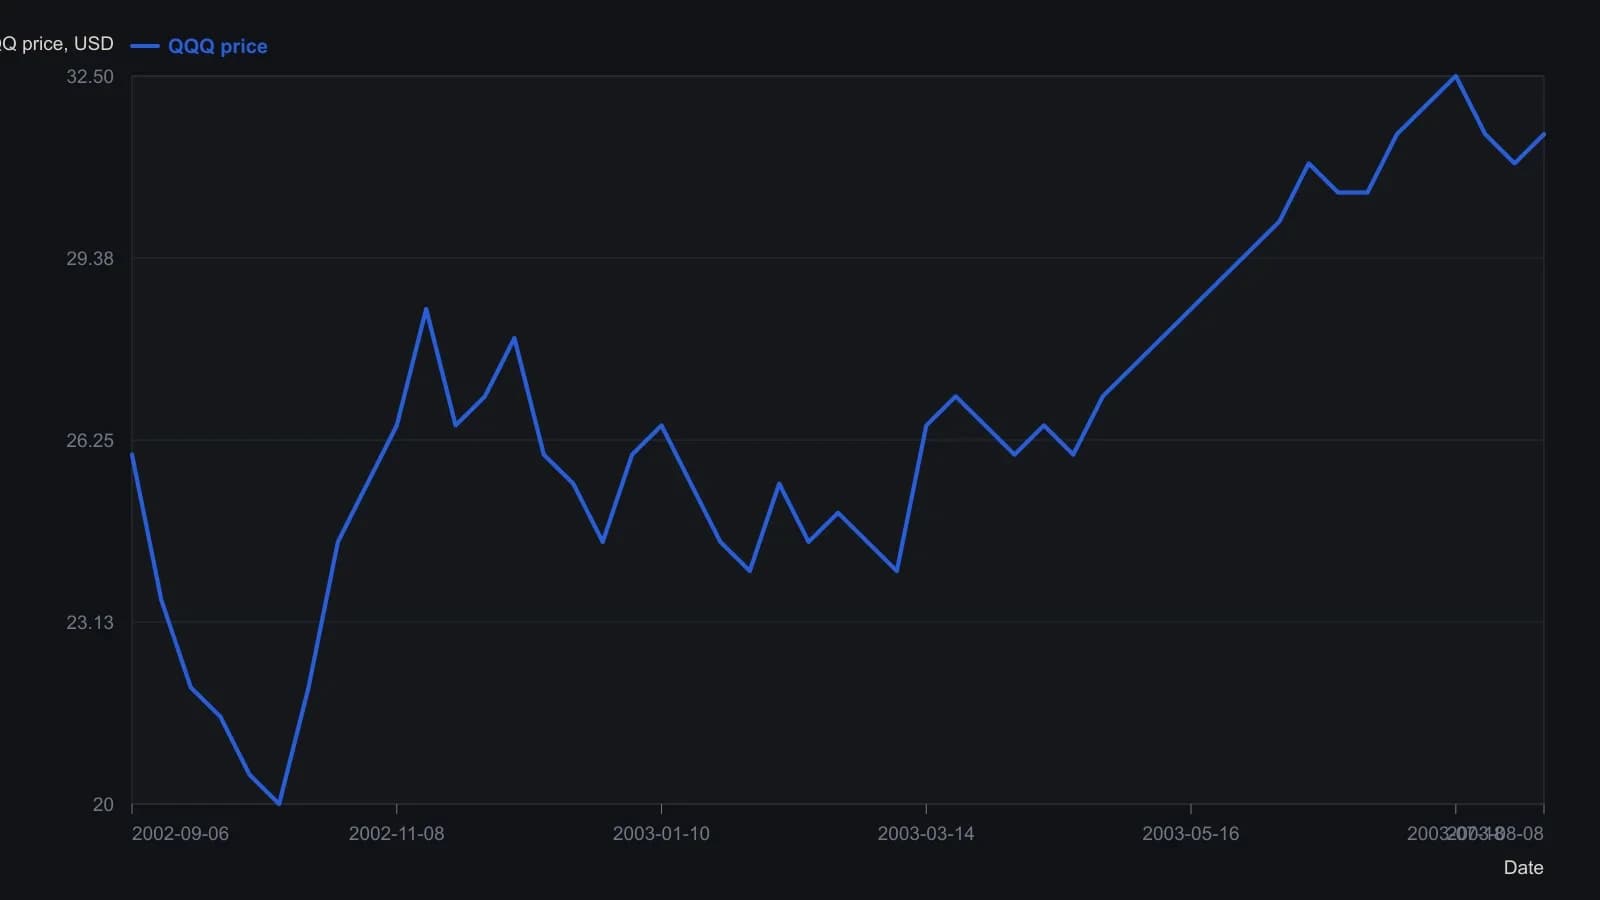
Digitized from the daily candlestick pane, not from a table. Samples are roughly weekly and rounded to 0.5. The source states a 21-week inner channel of about $3 (trendlines 1 and 3), a 26-week outer channel of about $5 (trendlines 2 and 4), an upper-line intersection near 32 in mid-June, and a following drop of $2 (6.4 percent) on volume above 150 million shares.
All readings on this track · 26 readings
- 1986Constructing bounded relative-strength overlays from oscillator limits
- 1989Point-and-figure fulcrum, count, and flag as three jobs
- 1996The high, tight flag as a three-checkpoint continuation exam
- 2000Test chart patterns with confirmation, not names
- 2001Failed chart patterns as reverse breakout signals
- 2002Ascending triangle and flag: a three-checkpoint QQQ case study
- 2002Two-stage chart reading after breakouts
- 2002The second pattern after a breakout
- 2003Building flags, pennants, and triangles as continuation pauses
- 2003When trendline channels age into a wedge or a break
- 2004Bearish chart patterns need confirmation before the turn
- 2004Constructing flags, pennants, and triangles from swing pivots
- 2005Constructing flag and pennant rules from pole to exit
- 2005Fanline construction for testing trend health
- 2005When flag-and-pennant breakout scans fail a measurement audit
- 2006Testing a bear-flag target after the pause is confirmed
- 2007Homebuilder rebound as a bear-flag, trendline, and volume case study
- 2008Completed chart patterns as reward-to-risk arithmetic
- 2012Reading this file
- 2012Reading regime change: when to stop trading
- 2014Intraday flag construction with breakout and stop rules
- 2015Lock lookback and chart scale before you mark a flag or pennant
- 2017Constructing delayed buy-stops on bull flags and pennants
- 2018Copy an ABC swing as a ruler, then test flags and Fibonacci degree
- 2019Failed flags, pennants, and triangles as a completed experiment
- 2020Confirming candlestick and flag signals on a weekly chart