1996issue C061-5
The high, tight flag as a three-checkpoint continuation exam
This editorial reading treats the high, tight flag as a rare continuation pause after a vertical advance from a long base. The archive cases are walked as a three-checkpoint exam: confirm the demand shock, require a shallow volume-quiet coil, and accept Breakout confirmation only if Volume-price analysis shows expansion strong enough to keep the hypothesis alive.
- A high, tight flag is defined as a rare pause after an advance of about 100% to 120% in roughly four to eight weeks, followed by a three-to-six-week sideways range that retraces no more than 10% to 20% of that advance.
- This editorial reading treats the setup as a three-checkpoint exam: a vertical demand shock after a long base, a shallow volume-quiet Flag and pennant pause, and Breakout confirmation only if volume expands enough to keep the hypothesis alive.
- Successful high, tight flag breakouts in the case set were required to show volume at least 40% above the 50-day average. Centocor's 1996 flag met duration and tightness but failed that volume test, faced older overhead resistance, and then retested the lower edge of the flag.
- Prior winning formations are kept as identification templates, while the high, tight flag is treated as powerful, easy to misread, and rare even though the structure can repeat.
A three-checkpoint continuation exam
This editorial reading treats the high, tight flag as a three-checkpoint continuation exam. First confirm a vertical demand shock after a long base. Then require a shallow volume-quiet pause. Only then accept the next upside resolution if volume expands enough to keep the hypothesis alive.
In this editorial framing, Flag and pennant structure supplies the pause. Volume-price analysis decides whether that pause is quiet enough and whether the next thrust is accompanied by expanding demand. Breakout confirmation is the last check, not the first observation.
What counts as a high, tight flag
A high, tight flag is defined as a rare pause after an advance of about 100% to 120% in roughly four to eight weeks, followed by a three-to-six-week sideways range that retraces no more than 10% to 20% of that advance.
A 40% to 60% surge in a few weeks is treated as often overextended when it is a late climax. The same vertical move can instead be the first leg of a larger advance if it leaves a long base and then coils into a high, tight flag.
Four sequences used as templates
In the 1991 Score Board sequence, a five-month base, a news-driven four-week doubling, and a three-week 10% flag formed the template, with volume swelling on the first breakout, drying up inside the flag, and surging again on the flag breakout.
The 1992 United Wisconsin case left a six-month base, rose about 90% in four weeks, then spent five weeks in a tightening flag where volume dried up before expanding on the breakout. The later advance was later aborted after a negative company announcement.
Zygo is presented as matching the profile after a three-year $3 to $5 range, a four-week rise to $12, and a six-week flag in which demand surged on the initial run, receded in the pause, and swelled again on the breakout to new highs.
Republic Industries is used as a pennant-style variant: a 250% burst in seven days, then a six-week flag of about 15% that coiled tighter near the end, with volume receding in the pause and expanding as price broke out.
Score Board (BSBL) base, flag pole, and high tight flag
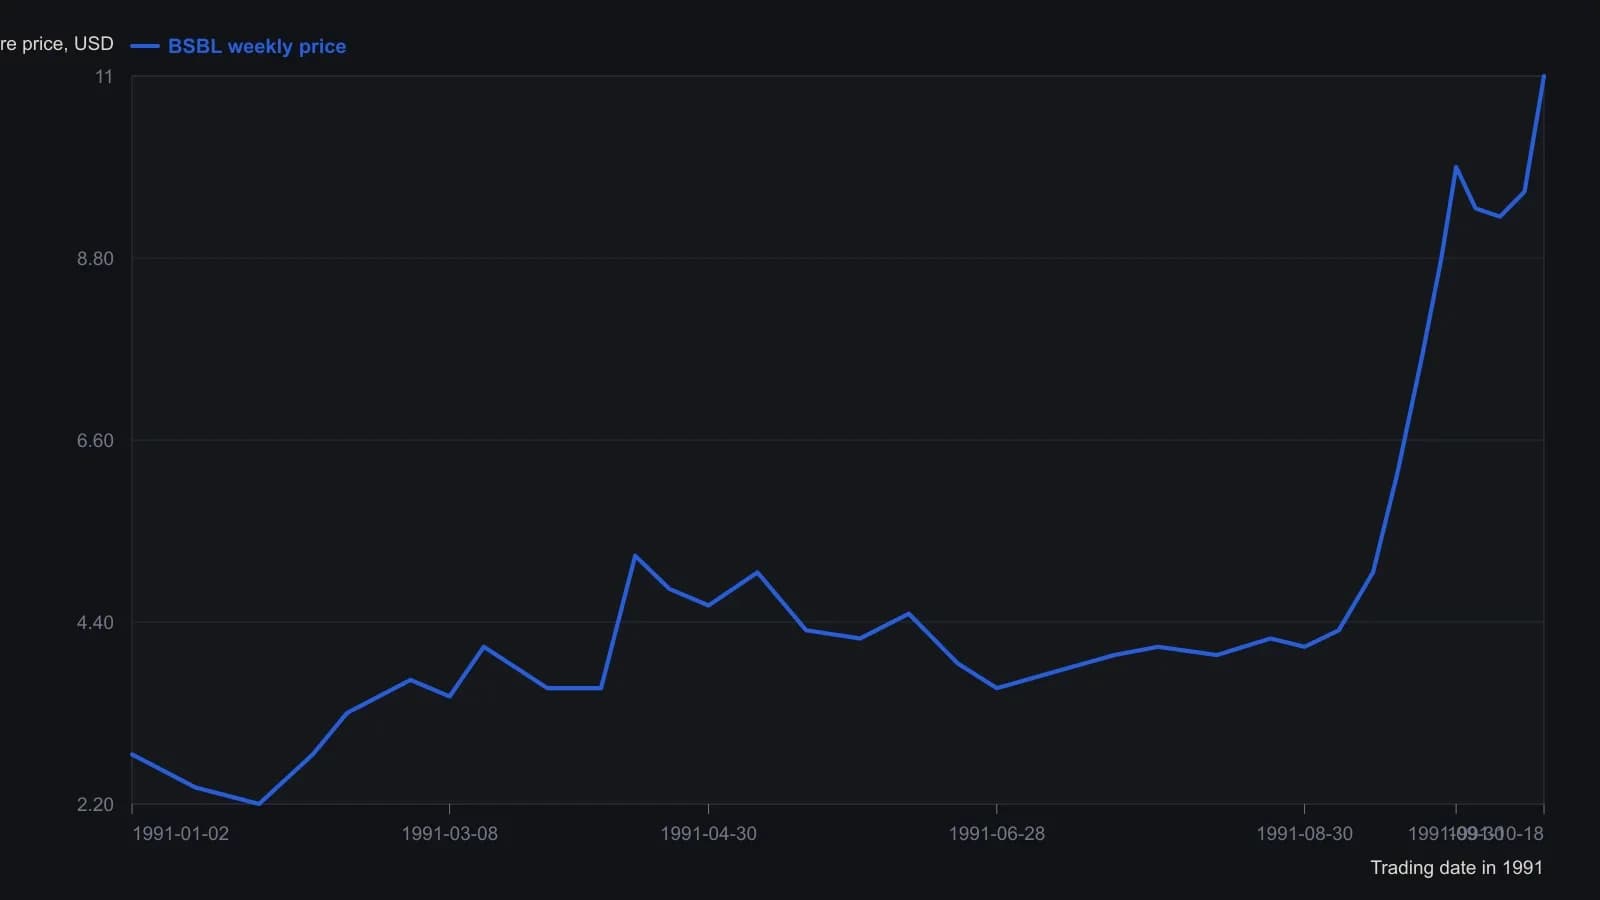
Closes are estimated from the raster to the nearest tenth of a dollar. Volume bars are visible but unscaled, so they are not plotted.
The volume test on breakout
Successful high, tight flag breakouts in the case set are required to show volume at least 40% above the 50-day average. Centocor's 1996 flag met duration and tightness but failed that volume test, faced older overhead resistance, and then retested the lower edge of the flag.
This editorial reading treats that volume expansion as the checkpoint that can keep the continuation hypothesis alive. Duration and tightness without Volume-price analysis support are not accepted as Breakout confirmation.
Why the templates stay rare
The teaching method is to keep prior winning formations as identification templates, while treating the high, tight flag as powerful, easy to misread, and rare even though the structure can repeat.
In this editorial reading, those sequences stay useful as identification templates, including the pennant-style coil in Republic Industries and the aborted later advance in United Wisconsin. The template is the repeatable structure, not a claim that the next resolution will be completed.
All readings on this track · 26 readings
- 1986Constructing bounded relative-strength overlays from oscillator limits
- 1989Point-and-figure fulcrum, count, and flag as three jobs
- 1996The high, tight flag as a three-checkpoint continuation exam
- 2000Test chart patterns with confirmation, not names
- 2001Failed chart patterns as reverse breakout signals
- 2002Ascending triangle and flag: a three-checkpoint QQQ case study
- 2002Two-stage chart reading after breakouts
- 2002The second pattern after a breakout
- 2003Building flags, pennants, and triangles as continuation pauses
- 2003When trendline channels age into a wedge or a break
- 2004Bearish chart patterns need confirmation before the turn
- 2004Constructing flags, pennants, and triangles from swing pivots
- 2005Constructing flag and pennant rules from pole to exit
- 2005Fanline construction for testing trend health
- 2005When flag-and-pennant breakout scans fail a measurement audit
- 2006Testing a bear-flag target after the pause is confirmed
- 2007Homebuilder rebound as a bear-flag, trendline, and volume case study
- 2008Completed chart patterns as reward-to-risk arithmetic
- 2012Reading this file
- 2012Reading regime change: when to stop trading
- 2014Intraday flag construction with breakout and stop rules
- 2015Lock lookback and chart scale before you mark a flag or pennant
- 2017Constructing delayed buy-stops on bull flags and pennants
- 2018Copy an ABC swing as a ruler, then test flags and Fibonacci degree
- 2019Failed flags, pennants, and triangles as a completed experiment
- 2020Confirming candlestick and flag signals on a weekly chart