1989issue C041-4
Point-and-figure fulcrum, count, and flag as three jobs
On one point-and-figure tape, congestion width is counted into an objective, a trendline only confirms or warns, and a brief flag-and-pennant pause only raises invalidation. The historical workflow is a sequence of tests, not a single picture.
- After a sizable rise or fall, a congestion-area is sideways activity inside a trading range, later readable as support or resistance once it spans more than five or six columns.
- A fulcrum is sized with a horizontal-count across the common base of its walls and is completed by a thrust at least one point beyond the counter-move extreme.
- A trendline needs at least three touches to be treated as usable and is not read alone, because a lone diagonal is a whipsaw risk.
- After the first advance, brief flag-and-pennant pauses raise invalidation two points beneath the flag instead of issuing a standalone forecast.
Three jobs on one tape
A point-and-figure chart records filtered price change as X and O columns instead of plotting every print against the clock. Box-size is the price increment that must print before another X or O is marked on the vertical scale. Reversal is the number of boxes required to start a new column in the opposite direction.
This case study follows one tape through a congestion-area, a fulcrum with a horizontal-count, collateral trendlines, and brief flags. An editorial reading is that those pieces do three different jobs. Width becomes a countable objective. Diagonal breaks become confirmation or warning. Brief flags become only invalidation checkpoints, so the pattern is a sequence of tests rather than a single picture.
Congestion as a range and a width
After a sizable rise or fall, point-and-figure congestion is treated as sideways activity inside a trading range. A rule of thumb of about 15 percent of price is used for a low-priced stock, 10 percent for a medium-priced stock, and 5 percent for a high-priced stock.
Congestion is ordinarily studied on a one-point box, one-box reversal chart. A half-point, one-box reversal chart is presented as possibly more useful when the stock is below 20.
How strongly a congestion-area later acts as support or resistance is said to depend in part on its width. More than five or six columns is offered as a general congestion threshold. In the worked example, a 13-column zone is judged substantial for that issue.
How the sideways phase ends
A congestion-area is described as continuing until an upside or downside breakout. Heavier activity at the bottom of the range is read as a hint of an upside break. Heavier activity at the top is read as a hint of a downside break.
Trendline as confirmation or warning
One trendline method connects successive X-column tops or O-column bottoms and treats at least three touches as establishing a usable line. A contrasting method draws a 45-degree line from the extreme high or low. Longer lines are treated as stronger.
Using a trendline without other chart evidence is flagged as a whipsaw risk: a false break that reverses quickly. An editorial reading is that the diagonal is collateral. It can confirm or warn. It is not the structure that sizes the next swing.
Recognizing a fulcrum
A fulcrum is recognized by a thrust to a new extreme, activity near that extreme, a later counter-move of about 15 percent, repeated tests of the extreme, and a subsequent thrust that goes at least one point beyond the counter-move extreme. The walls of that congestion structure are what make the next swing countable.
Horizontal-count from the common base
A fulcrum objective is formed by a horizontal-count. Columns between the left and right walls are counted at their common base, and that count is added to the base price. In the first example the walls run from column 14 to column 27, the common base is 29, the count is 14, and the stated objective is 43.
Universal Widget 1x1 point-and-figure path and counted objectives
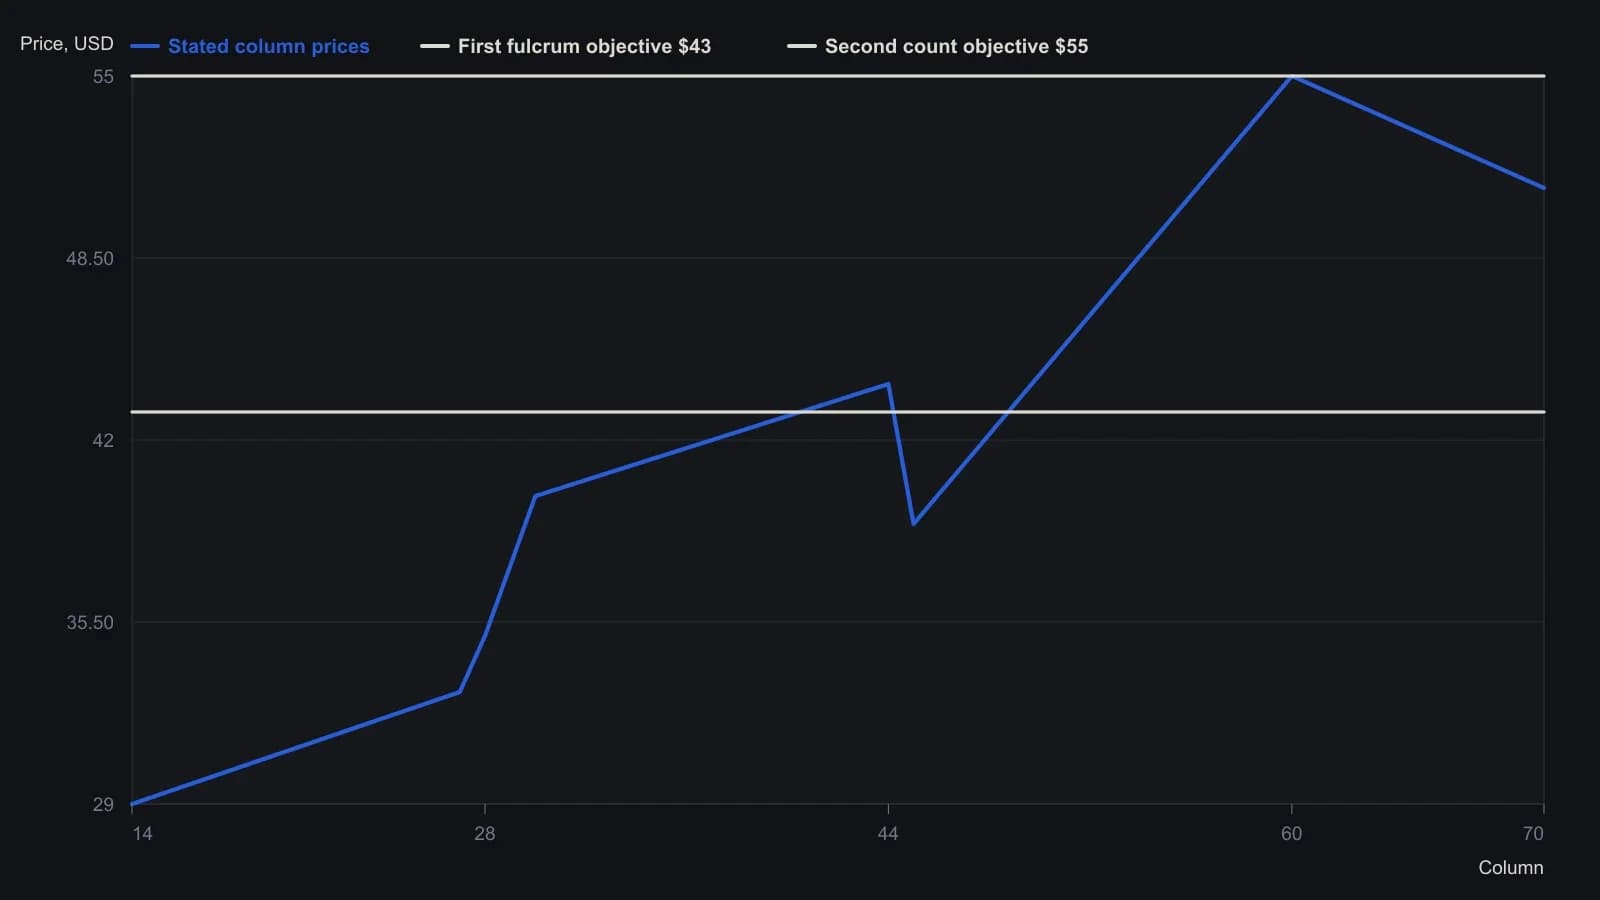
One-point box, one-box reversal (1x1). Horizontal count is columns spanned inclusive, added to the common-base price. Chart uses only prices the article states; unquoted intra-column ticks are omitted.
Flags as invalidation stations
After the first advance, brief flag pauses of a few columns are used as stations to raise invalidation a stated two points beneath the flag. In this case study the flag-and-pennant pause is used to raise invalidation, not to issue a standalone forecast.
The same passage cautions that the projection method should not be expected to be highly accurate even when price later approaches the counted objective.
A second count in the same advance
A later mid-trend fulcrum is counted 16 columns across the 39 line from column 30 to column 45, producing a second objective of 55. An uptrend line that gains a third touch at column 51 is treated as collateral confirmation. Invalidation is still placed just under the latest flag rather than on that line.
An editorial reading is that the second count updates the objective while the flag, not the trendline, remains the place the hypothesis fails.
When the line meets later congestion
When the established uptrend line later touches a new congestion zone around column 70, a breakout from that zone in either direction is expected. A downward completion of an inverse fulcrum is treated as a decline setup. The earlier wide congestion between columns 30 and 45 is expected to act as support on the way down.
All readings on this track · 26 readings
- 1986Constructing bounded relative-strength overlays from oscillator limits
- 1989Point-and-figure fulcrum, count, and flag as three jobs
- 1996The high, tight flag as a three-checkpoint continuation exam
- 2000Test chart patterns with confirmation, not names
- 2001Failed chart patterns as reverse breakout signals
- 2002Ascending triangle and flag: a three-checkpoint QQQ case study
- 2002Two-stage chart reading after breakouts
- 2002The second pattern after a breakout
- 2003Building flags, pennants, and triangles as continuation pauses
- 2003When trendline channels age into a wedge or a break
- 2004Bearish chart patterns need confirmation before the turn
- 2004Constructing flags, pennants, and triangles from swing pivots
- 2005Constructing flag and pennant rules from pole to exit
- 2005Fanline construction for testing trend health
- 2005When flag-and-pennant breakout scans fail a measurement audit
- 2006Testing a bear-flag target after the pause is confirmed
- 2007Homebuilder rebound as a bear-flag, trendline, and volume case study
- 2008Completed chart patterns as reward-to-risk arithmetic
- 2012Reading this file
- 2012Reading regime change: when to stop trading
- 2014Intraday flag construction with breakout and stop rules
- 2015Lock lookback and chart scale before you mark a flag or pennant
- 2017Constructing delayed buy-stops on bull flags and pennants
- 2018Copy an ABC swing as a ruler, then test flags and Fibonacci degree
- 2019Failed flags, pennants, and triangles as a completed experiment
- 2020Confirming candlestick and flag signals on a weekly chart