2001issue C111-5
Failed chart patterns as reverse breakout signals
When a chart pattern does not follow through after a breakout, the failed follow-through can reverse the original hypothesis rather than only end it. Historical bull-trap, bear-trap, flag, pennant, neckline, and trendline cases complete that reverse reading with a later close through the opposite boundary.
- When a pattern does not follow through after a breakout, the failed follow-through can reverse the original hypothesis rather than only cancel it.
- A bull trap is complete when price breaks above resistance, attracts new longs, and later closes back below that same line. A bear trap is the mirror sequence at support.
- Flag and pennant failure is confirmed by a close through the opposite extreme after a breakout in the expected direction.
- A reverse head-and-shoulders can fail within a few days after the first neckline clearance, and a trendline break is confirmed as failed when price recrosses the same sloping line.
A failed breakout can reverse the hypothesis
When a chart pattern does not follow through after a breakout, the failed follow-through can be treated as a reason to reverse the original hypothesis rather than only to exit.
A failed-breakout is a move that first clears a pattern or level in the expected direction, then closes back through the opposite boundary.
Bull traps and bear traps
A bull-trap is an upside clearance of resistance that later closes back below the same line and leaves new longs on the wrong side of the market. The sequence is identified when price breaks above resistance, attracts new longs, then later closes back below that resistance. ABT cleared a resistance line on 28 November 2000 and later closed back below that line on 6 December 2000, completing the bull-trap sequence.
A bear-trap is a downside break of support that later closes back above the same line and leaves new shorts on the wrong side of the market. The sequence is identified when price breaks below support, attracts new shorts, then later closes back above that support. AFL traded below a support line and then closed back above that line on 15 March 2000, completing the bear-trap sequence.
Abbott Laboratories bull trap at $54 resistance
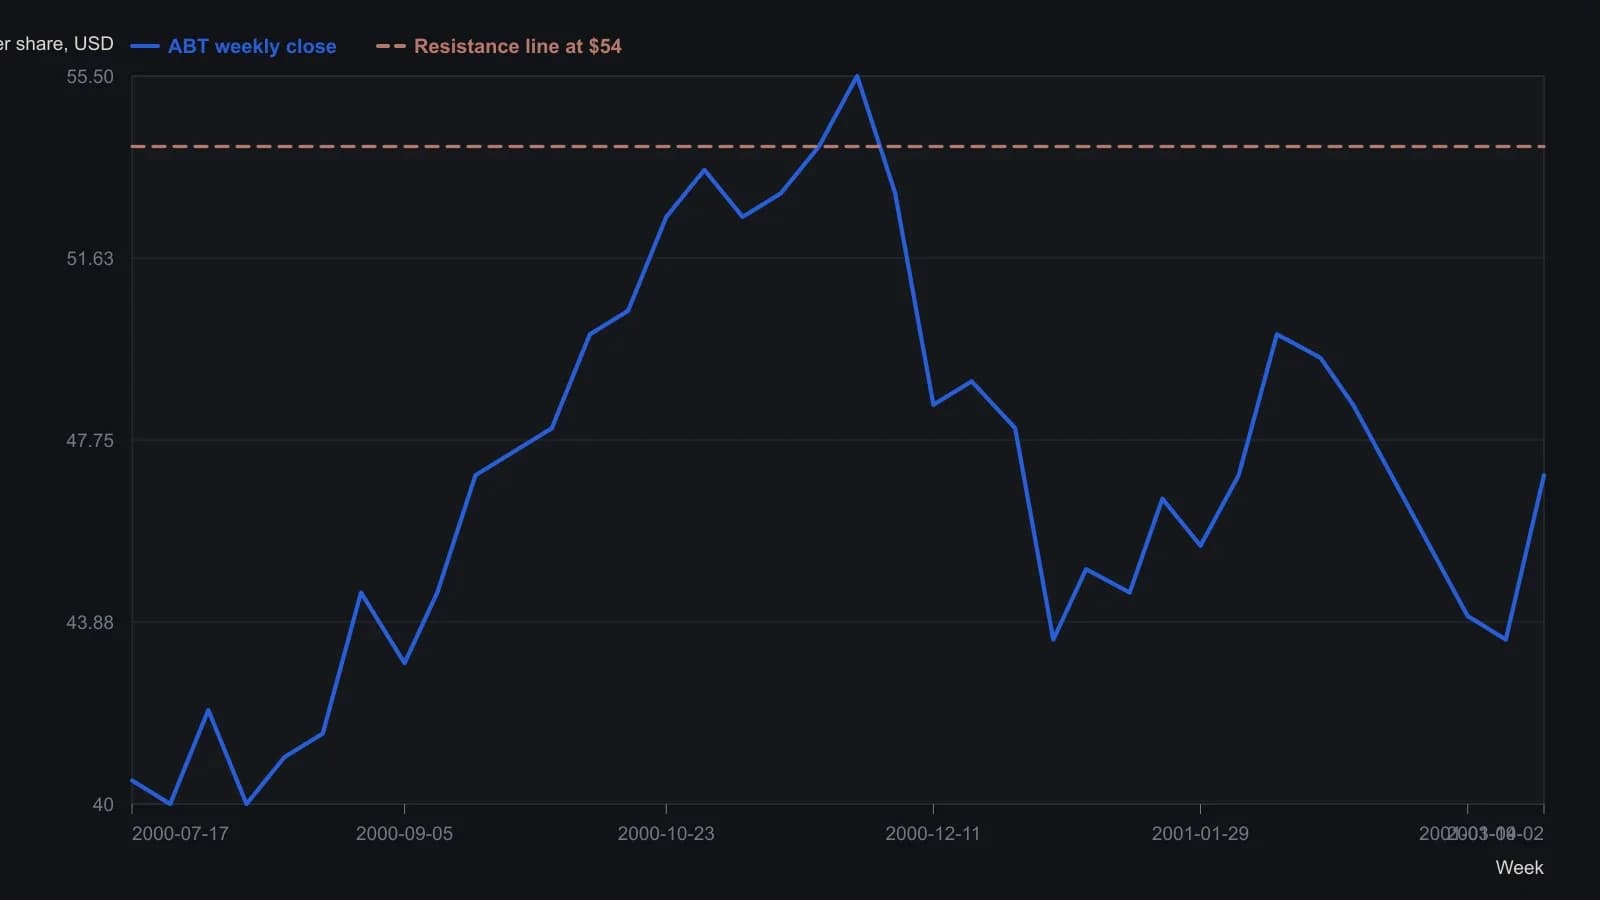
Closes are sampled once per labeled week from the daily candles and rounded to the nearest half dollar, the finest step the raster supports. Volume bars were not digitized.
Head-and-shoulders neckline failure
A head-and-shoulders is a reversal structure whose neckline break can itself fail within a few sessions and be treated as a reverse signal. A reverse head-and-shoulders breakout can fail within a few days after price first clears the neckline.
Trendline recrosses
A trendline-failure is a crossing of a sloping trendline that does not hold and is later recrossed, confirming the break did not persist. A failed trendline breakout is confirmed when price recrosses the same sloping line after an earlier break of that line. CSCO did so after an early-December 2000 upside break of a descending trendline.
Flag and pennant opposite closes
A flag-and-pennant is a brief consolidation after a sharp move. Failure is marked by a close through the side opposite the first breakout. A flag or pennant failure is confirmed by a close through the opposite extreme after a breakout in the expected direction. ABX closed back below a flag after a 6 March 2001 upside break. AV closed back below a pennant after an upside close.
Editorial two-step reading
In this TradersWeek editorial reading, flags, pennants, head-and-shoulders, and level breaks are two-step tests. The first breakout states a direction. A later close through the opposite boundary converts that same structure into the opposite, falsifiable hypothesis. The archive describes the historical workflow only. This two-step teaching frame is editorial and is not attributed to the archive.
All readings on this track · 26 readings
- 1986Constructing bounded relative-strength overlays from oscillator limits
- 1989Point-and-figure fulcrum, count, and flag as three jobs
- 1996The high, tight flag as a three-checkpoint continuation exam
- 2000Test chart patterns with confirmation, not names
- 2001Failed chart patterns as reverse breakout signals
- 2002Ascending triangle and flag: a three-checkpoint QQQ case study
- 2002Two-stage chart reading after breakouts
- 2002The second pattern after a breakout
- 2003Building flags, pennants, and triangles as continuation pauses
- 2003When trendline channels age into a wedge or a break
- 2004Bearish chart patterns need confirmation before the turn
- 2004Constructing flags, pennants, and triangles from swing pivots
- 2005Constructing flag and pennant rules from pole to exit
- 2005Fanline construction for testing trend health
- 2005When flag-and-pennant breakout scans fail a measurement audit
- 2006Testing a bear-flag target after the pause is confirmed
- 2007Homebuilder rebound as a bear-flag, trendline, and volume case study
- 2008Completed chart patterns as reward-to-risk arithmetic
- 2012Reading this file
- 2012Reading regime change: when to stop trading
- 2014Intraday flag construction with breakout and stop rules
- 2015Lock lookback and chart scale before you mark a flag or pennant
- 2017Constructing delayed buy-stops on bull flags and pennants
- 2018Copy an ABC swing as a ruler, then test flags and Fibonacci degree
- 2019Failed flags, pennants, and triangles as a completed experiment
- 2020Confirming candlestick and flag signals on a weekly chart