2004issue C011-5
Bearish chart patterns need confirmation before the turn
Every topping formation is a two-part hypothesis: first identify the repeatable price structure, then wait for a confirming close. Confirmation, height, and remaining trend life turn a familiar chart condition into a checkable downside case.
- A bearish pattern is a live downside hypothesis only after confirmation, most often a close below the formation low.
- An island top isolated by overlapping gaps can form a height-based target by subtracting the pattern range from the lowest low inside the island.
- Most rectangle breakouts continue the prior trend, so an advance into the box is more often followed by an upward exit.
- Late-trend descending scallops are treated as possible end-of-decline warnings rather than fresh short setups.
A two-part hypothesis
The historical workflow treats a topping formation as two steps. First identify a repeatable price structure on the chart. Then wait for confirmation before acting. Confirmation is a close that completes the pattern's bearish rule, most often a close below the formation's lowest low. Until that close prints, the prior advance remains able to resume.
This editorial reading is not a ranking of pattern names. It is a way to turn a recognizable chart condition into a checkable downside case by pairing structure with confirmation, height, and remaining trend life.
Islands, pipes, and a height target
An island top is identified after an advance when an upward gap and a later downward gap share at least one common price. Those gaps isolate a pocket of trading above the surrounding range. That island reversal is the structure. A height-based island target is then formed by subtracting the pattern high-to-low range from the lowest low inside the island. In editorial terms, that is a price target from height: a projected low taken from the pattern itself.
A pipe top is read on a weekly chart as two unusually long parallel spikes standing clear of adjacent weeks after an advance. The two spikes are the weekly topping pair. They still wait on the same confirmation rule before the downside hypothesis is treated as live.
Island top on Tech Sym Corp
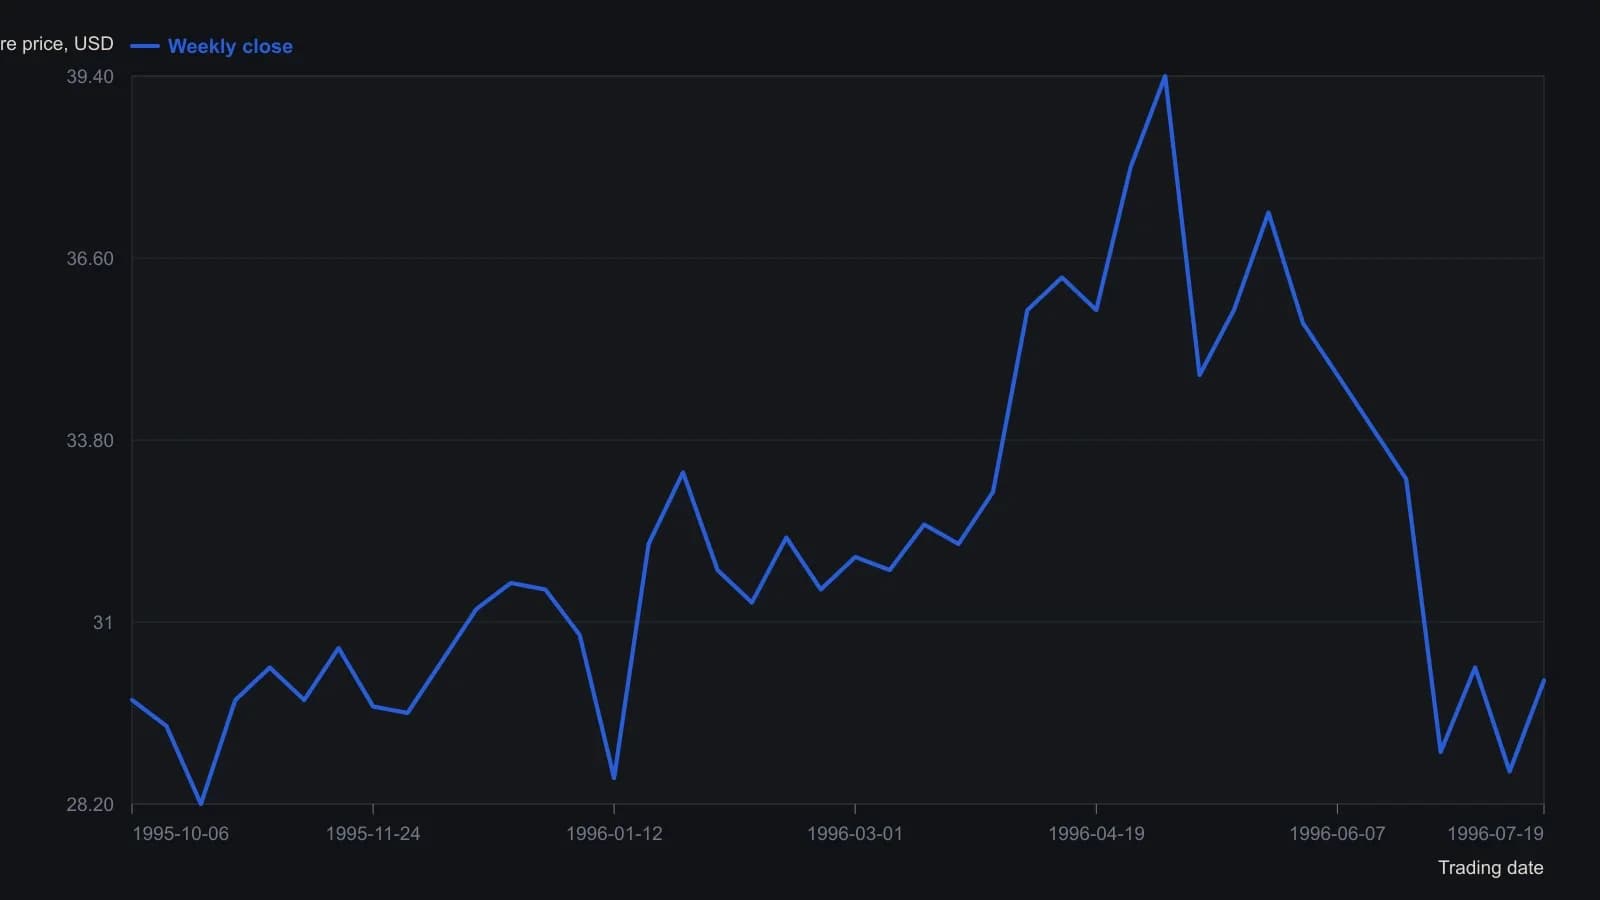
Closes sampled about once a week from the raster, to the nearest few tenths of a dollar. Unscaled volume bars are omitted.
Stair-steps and rectangle boxes
A measured move down is a stair-step. After a first decline, a corrective rebound typically retraces 40% to 60% and should not approach the top of the first leg. The second decline is then expected to be similar in percentage length to the first.
A rectangle top is a nearly horizontal consolidation entered from below. Each bounding trendline needs at least two distinct touches, and volume generally recedes while the box forms. Breakouts can occur in either direction. Most continue the prior trend, so an advance into the box is more often followed by an upward exit. In editorial terms, an advance into a rectangle is not, by itself, a short setup.
Wedges, falling peaks, and late copies
A rising wedge is an upward-tilted triangle of rising highs and rising lows between two converging upsloping trendlines. It lasts at least three weeks. Shorter copies are classed as pennants. Each line needs at least two touches, and the typical breakout arrives around 61% of the way to the apex.
Three falling peaks require three consecutively lower minor highs of similar width or prominence. They are used as a trend-change structure, not as a mix of wide and narrow peaks. A triple top is a different reading: three similar peaks whose bearish case is confirmed only by a close below the lowest low of the entire formation.
A descending scallop is a reverse-J in a downtrend: a near-straight drop, a bowl-shaped base, then a further decline measured from the right lip. Late-trend copies are treated as possible end-of-decline warnings rather than fresh short setups. In editorial terms, remaining trend life decides whether the same reverse-J is a continuation case or a warning that the decline may be ending.
In editorial terms, the lesson is not which pattern is best. The historical workflow names the structure, waits for confirmation, measures height when the pattern supplies a range, and treats late-trend copies with more caution than early ones.
All readings on this track · 26 readings
- 1986Constructing bounded relative-strength overlays from oscillator limits
- 1989Point-and-figure fulcrum, count, and flag as three jobs
- 1996The high, tight flag as a three-checkpoint continuation exam
- 2000Test chart patterns with confirmation, not names
- 2001Failed chart patterns as reverse breakout signals
- 2002Ascending triangle and flag: a three-checkpoint QQQ case study
- 2002Two-stage chart reading after breakouts
- 2002The second pattern after a breakout
- 2003Building flags, pennants, and triangles as continuation pauses
- 2003When trendline channels age into a wedge or a break
- 2004Bearish chart patterns need confirmation before the turn
- 2004Constructing flags, pennants, and triangles from swing pivots
- 2005Constructing flag and pennant rules from pole to exit
- 2005Fanline construction for testing trend health
- 2005When flag-and-pennant breakout scans fail a measurement audit
- 2006Testing a bear-flag target after the pause is confirmed
- 2007Homebuilder rebound as a bear-flag, trendline, and volume case study
- 2008Completed chart patterns as reward-to-risk arithmetic
- 2012Reading this file
- 2012Reading regime change: when to stop trading
- 2014Intraday flag construction with breakout and stop rules
- 2015Lock lookback and chart scale before you mark a flag or pennant
- 2017Constructing delayed buy-stops on bull flags and pennants
- 2018Copy an ABC swing as a ruler, then test flags and Fibonacci degree
- 2019Failed flags, pennants, and triangles as a completed experiment
- 2020Confirming candlestick and flag signals on a weekly chart