2002issue C091-3
Size from stop distance to keep dollar risk even
The archive keeps planned loss inside a chosen equity bound by solving share count from stop distance. Editorial: a two-to-one chart shape is an account rule only after that size is set, and a comfortable fixed lot is a hidden leverage change when stops are not uniform.
- Dollar risk equals share count times stop distance, so a repeated lot keeps even money at risk only when stop distances stay similar.
- Volatility position sizing chooses share count from account equity and the live stop distance so planned loss stays inside a chosen dollar bound.
- A two-to-one risk-reward ratio means two units of planned gain for each unit risked, and it reaches arithmetic breakeven at 34% accuracy before costs.
- Once every ticket risks the same dollars, no single trade can damage the account more than any other.
Share count sets the planned dollar loss
Volatility position sizing chooses share count from account equity and the live stop distance so planned loss stays inside a chosen dollar bound. Dollar risk is the account money that would be lost if the planned stop is hit, equal to share count times stop distance. Stop distance is the price gap from entry to the invalidation level used to compute size.
A single-trade cap of 5% of account equity is given as a general bound, with a 1% to 2% of cash equity band often used for intraday work. On a 25000-dollar account those fractions equal 250 dollars at 1% and 1250 dollars at 5%.
Share counts that hold each stop to a $250 loss
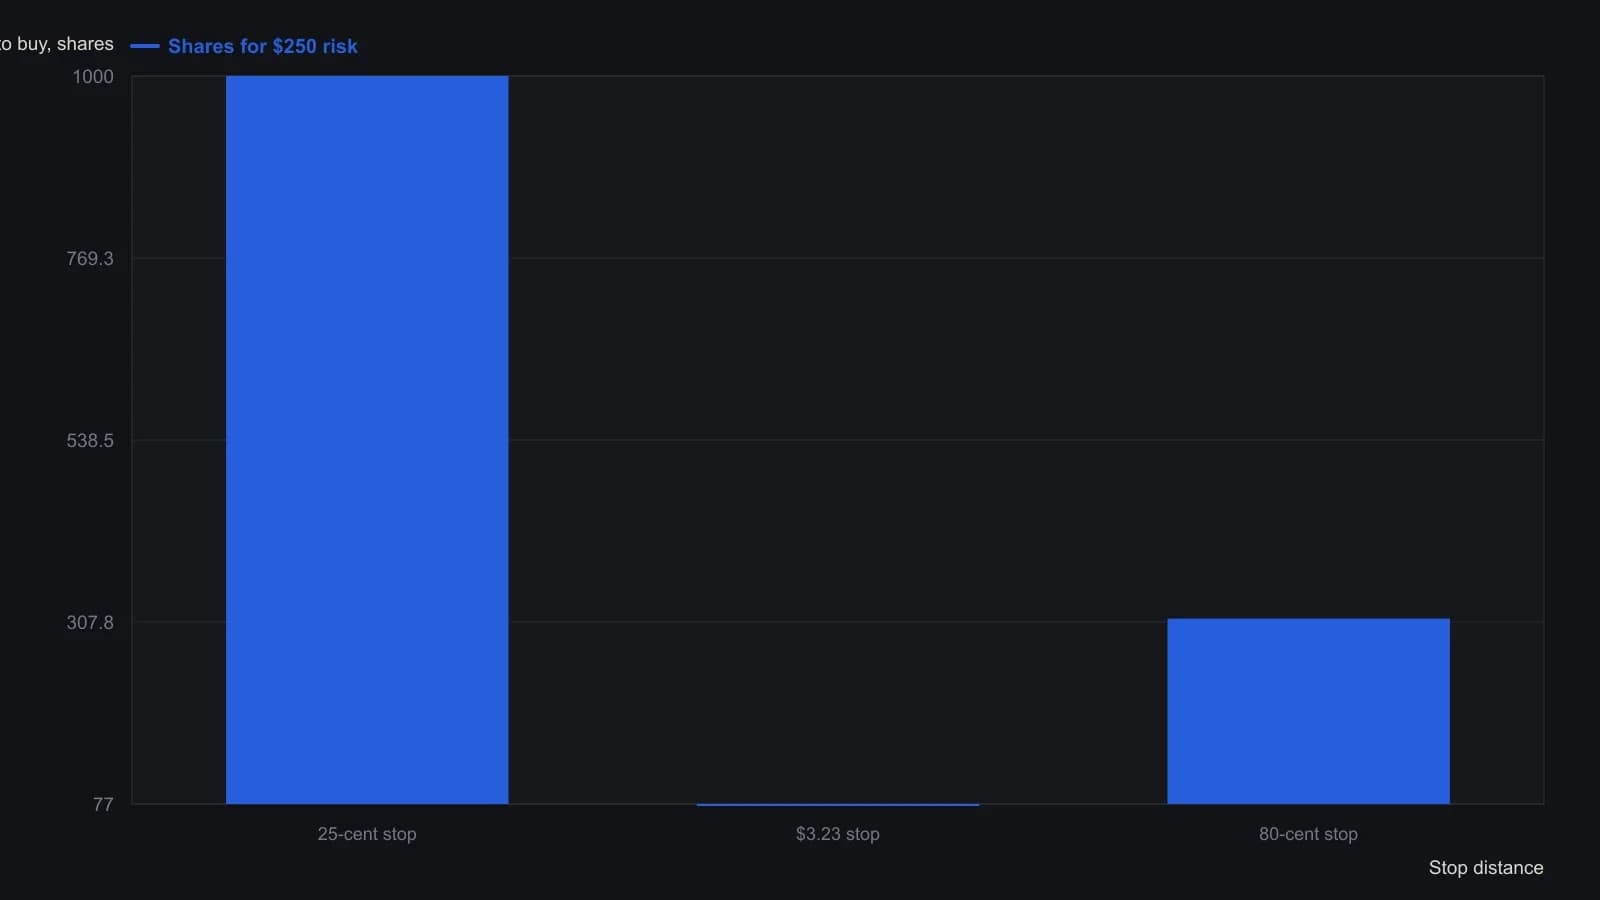
Share counts follow the article's own rounding: 77 shares times a $3.23 stop books a $248 loss rather than a perfect $250.
A fixed lot stays even only when stops stay similar
Fixed contract sizing repeats the same share or contract count on every setup. Dollar risk stays even only when stop distances themselves stay similar. Repeating a comfortable fixed lot of 200, 500, or 1000 shares can still be destructive when stop distances are not stable across setups.
A style whose stops stay near 20 cents and whose gains cluster between 20 and 60 cents can keep dollar risk even with a constant 1000-share lot. A style whose stops range from about 30 cents to 3 points, and that may hold a 1.40-dollar stop and a 25-cent stop on the same day, must change share count to keep more dollars on winners than on losers.
Two-to-one on the chart still needs even dollar risk
A risk-reward ratio is planned gain measured in the same units as the planned loss. A two-to-one objective means two units of expected gain for each unit risked at entry. That objective reaches arithmetic breakeven at 34% accuracy when 66 unit losses of 1 and 34 unit gains of 2 net near zero before costs.
If loss sizes are allowed to wander while the intended ratio stays two-to-one on the chart, the account-level edge is reduced or cancelled. Editorial: the chart ratio is not yet an account rule until share count has been solved from stop distance.
Sizing three two-to-one trades with stops of 25 cents, 3.23 dollars, and 80 cents to a 250-dollar risk uses about 1000, 77, and 312 shares and yields about +500, -248, and +499 dollars. Taking those same three trades at one unchanged share count produces a combined point result of -1.13, while the dollar-scaled book totals a 751-dollar gain.
Once size is scaled so every ticket risks the same dollars, no single trade can damage the account more than any other.
All readings on this track · 21 readings
- 1987Volatility-layered mechanical system with fixed contracts
- 1994Starting capital from worst-case portfolio walk-forwards
- 1994Bound small-account risk before adding leverage
- 1996Variable position size after entry
- 1996Equity path filters for contract size and drawdown
- 1997Stop distance, equity caps, and trading halts
- 1999Size-matched buy-and-hold evaluation for stock systems
- 2002Size from stop distance to keep dollar risk even
- 2003Share size from daily profit equilibrium
- 2004Half-size energy futures as a pre-trade leverage filter
- 2007Equalizing contract risk in trend following
- 2007Expected-equity sizing and geometric drag
- 2007Predefine the loss before fixed contract sizing
- 2013Weekday, session, and market expectancy for contract size
- 2014Bounded leverage before you size a trade
- 2015Equal-dollar futures size and open-interest liquidity
- 2015Atomize trading decisions: discipline over complexity
- 2017Tiny bets, ruin risk, and mechanical scale
- 2018Near-strike weekly puts and unfunded assignment risk
- 2019Paper trading is unfinished without fill and size rules
- 2019Constructing futures leverage from margin and fixed size