1986issue C061-10
Why Fourier windows limit dominant-cycle resolution
Fourier harmonics sit only on integer divisions of the observation window, so a 64-observation sample can estimate 64, 32, 21.3, 16, 12.8, and 10.7 days and has no amplitude between 16 and 21.3 days unless the sample is lengthened. A short-window maximum-entropy spectrum can name a dominant cycle from about one period of data, but both methods still need a score for cancelled short-cycle amplitude, mis-scaled harmonics, and spurious peaks before the recovered rhythm is treated as a forecast input.
- Fourier analysis isolates harmonics only on integer divisions of the observation-window length, so a 64-observation sample can estimate 64, 32, 21.3, 16, 12.8, and 10.7 days and has no amplitude between 16 and 21.3 days unless the sample is lengthened.
- Lengthening that Fourier window to raise resolution can let a shorter cycle change phase and cancel in the amplitude estimate, even when the cycle is large in the most recent data.
- Maximum-entropy spectrum analysis does not treat the sample as repeating outside the window and can isolate a high-resolution period from roughly one cycle of observations.
- Score both spectra for cancelled short-cycle amplitude, mis-scaled harmonics, and spurious peaks before treating the dominant cycle as a forecast input.
A window-design lab
This editorial reading treats cycle tools as a window-design lab. The first job is to show that Fourier harmonics sit only on integer divisions of the sample length, then to contrast that rigid grid with a short-window maximum-entropy spectrum that can name a dominant cycle from about one period of data.
A price path can be written as a constant plus sine and cosine terms of many periods so that each cyclic component can be recovered from the composite series. The dominant cycle is the highest-amplitude periodic component recovered from an ordered price sample and used as the reference period for later cycle work. The observation window is the contiguous run of ordered prices submitted to a spectrum estimate. Its length sets Fourier harmonic spacing and can also bias maximum-entropy amplitudes and false peaks.
Fourier harmonics sit only on integer divisions
Fourier analysis is a sine-and-cosine decomposition that isolates each harmonic by integrating over an integer number of cycles of that period and then reports power from the squared coefficients. Because sine and cosine families are orthonormal over a full period, multiplying the series by a chosen cosine and integrating isolates that coefficient while unmatched terms integrate to zero. That orthonormal isolation leaves only the coefficient of the matching harmonic.
Fourier analysis must integrate over an integer number of cycles, so a 64-observation window can resolve only the harmonic set 64, 32, 21.3, 16, 12.8, and 10.7 days, with no amplitude estimate for periods between 16 and 21.3 days unless the sample is lengthened.
Lengthening the window can cancel a short cycle
Lengthening the Fourier window to raise resolution can let a shorter cycle change phase across the sample and cancel in the amplitude estimate, even when that cycle is large in the most recent data. Fourier analysis treats the chosen sample as repeating to infinity. Shortening or stretching that sample to force integer cycles changes the observations and can distort the calculated spectrum.
Fourier integration discards relative phase and reports component power from the sum of squared sine and cosine coefficients.
A short maximum-entropy window can name the period
Maximum-entropy spectrum analysis is an iterative spectrum estimate that strips cyclic structure from the observed sample until the residual is treated as maximally uninformative, without assuming the sample repeats outside the window. It does not assume observations exist outside the selected window.
The comparison states that roughly one cycle of observations can suffice for a high-resolution maximum-entropy isolation, citing four weeks of data as adequate to separate a 17-day cycle. Maximum-entropy analysis is described as retaining phase so the measured cycles can be extended as a composite path.
Score cancelled amplitude, mis-scaled harmonics, and spurious peaks
On a synthetic sawtooth built from 30-day, half-amplitude 15-day, and one-third-amplitude 10-day components, a 35-observation maximum-entropy run labeled the dominant period 28 days, a 6.7 percent period error, recovered the 15- and 10-day periods exactly, matched the 15-day amplitude at -6 dB, and missed the expected -10 dB level for the 10-day amplitude.
Maximum-entropy spectra can misstate relative cycle amplitudes and can introduce spurious components when the analysis window is too long. Editorially, both methods should be scored on cancelled short-cycle amplitude, mis-scaled harmonics, and spurious peaks before anyone treats the recovered rhythm as a forecast input.
MESA spectrum of the sawtooth test wave
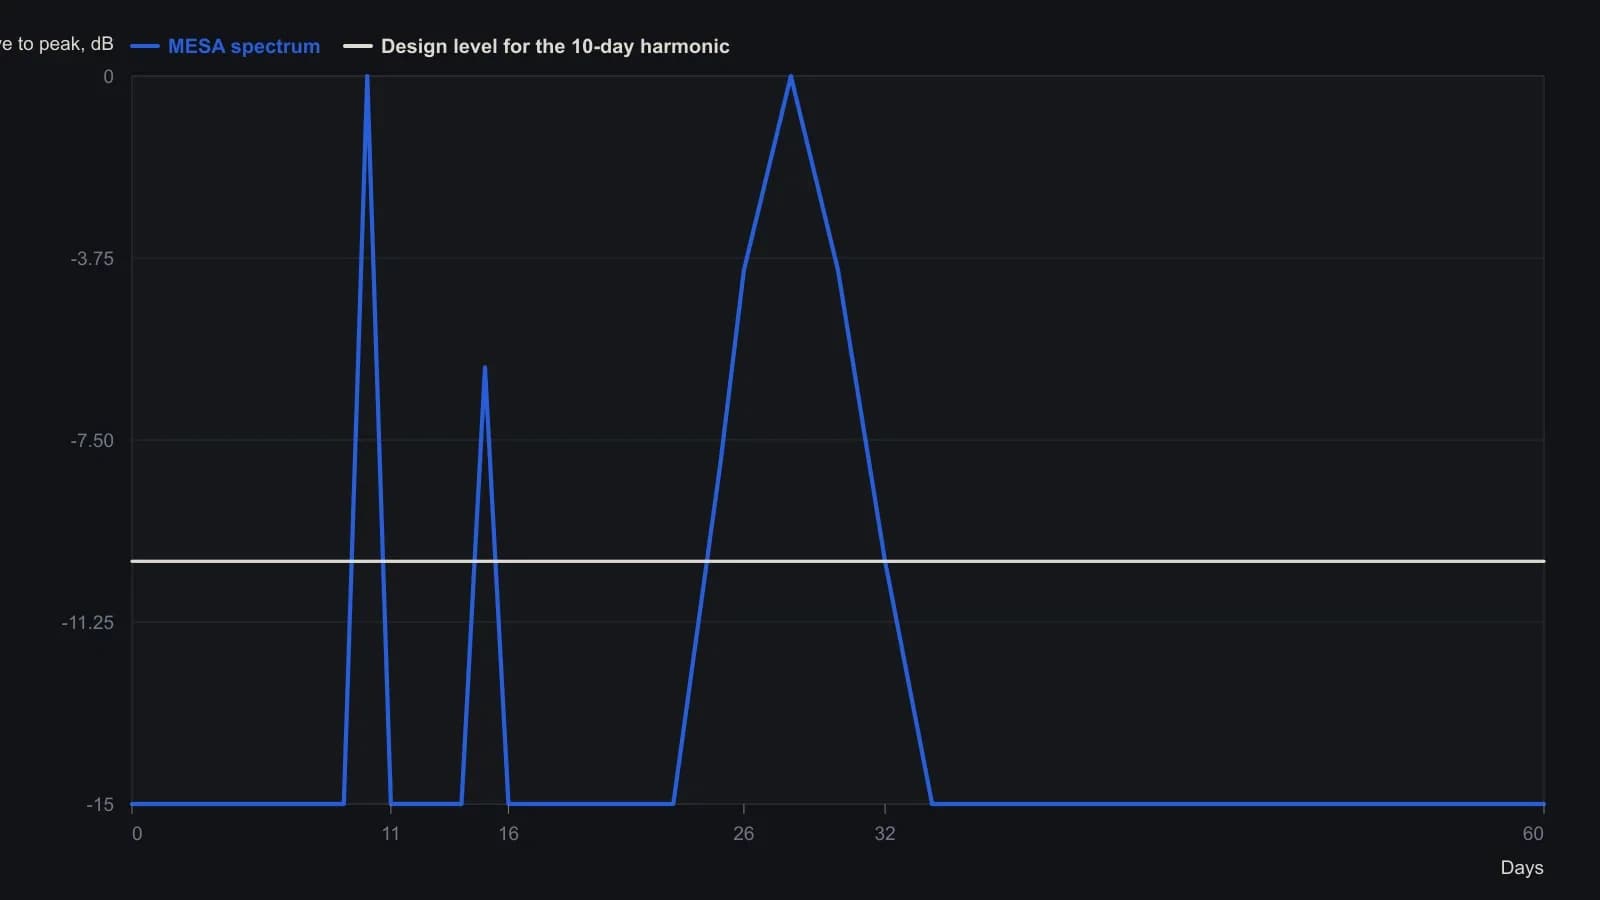
MESA used 35 daily observations. The sawtooth was synthesized from a 30-day wave, a half-amplitude 15-day harmonic, and a one-third-amplitude 10-day harmonic; the 30-day component is recovered as 28 days (6.7 percent error). Samples on the unlabeled floor are clipped to -15 dB, the last printed tick.
All readings on this track · 28 readings
- 1984Constructing maximum-entropy spectra for dominant-cycle forecasts
- 1984How to construct a maximum-entropy cycle model
- 1984Constructing a maximum-entropy forecast from a chosen lookback
- 1985Constructing period-locked half-cycle and full-cycle averages
- 1986Why Fourier windows limit dominant-cycle resolution
- 1987Assembling short-lookback maximum-entropy cycle forecasts
- 1988Why a fitted dominant cycle is not a forecast
- 1989Evaluating commodity cycle personalities with spectral histograms
- 1989Evaluating next-session cycle forecasts with stops
- 1989Constructing cycle-aged volatility trailing stops
- 1990A channel signal-to-noise gate for dominant-cycle forecasts
- 1990Year-over-year dominant cycle personality audit
- 1991Cyclic entry from a locked dominant-cycle phase
- 1992Stationarity states on synchronized futures spectral contours
- 1997Hidden horizon assumptions in dominant-cycle readings
- 1997When market cycles are absent more than present
- 1997A spectral estimator that retunes indicators to the measured cycle
- 2000Constructing a Hilbert dominant cycle and a maximum-entropy refinement
- 2000Switch trend and cycle indicators after a half-cycle dwell test
- 2000Constructing a dominant-cycle squelch trend filter
- 2000Phasor displays for dominant-cycle construction
- 2002Low-lag trendline from elliptic and dominant-cycle notches
- 2004Spectral peaks are mode diagnostics, not forecasts
- 2004Compressive last-stage oscillator construction
- 2013Constructing trend failure curves from qualified-trend transitions
- 2014Lookback range, a two-lag smoother, and next-bar fills
- 2014Constructing a MESA stochastic with roofing and SuperSmoother filters
- 2016Constructing spectral heatmaps for dominant market cycles