2014issue C0156-60
Constructing a MESA stochastic with roofing and SuperSmoother filters
This article reconstructs a SuperSmoother, a roofing filter, and a MESA stochastic oscillator from their stated lookbacks and coefficients.
- The SuperSmoother is a two-pole recursion with a 10-bar cutoff, and the current input is the average of this close and the prior close.
- The roofing stage applies a high-pass recursion whose alpha is computed from a 48-bar period, then feeds that output into the same 10-bar SuperSmoother.
- The MESA stochastic takes a 20-bar highest-high and lowest-low ratio of the roofed series and then applies the SuperSmoother to that ratio.
- Example systems treat 0.2 as the oversold threshold and 0.8 as the overbought threshold for a countertrend reverse.
Three linked components
The 2014 implementations reconstruct three linked components from one article: a SuperSmoother, a roofing filter, and a MESA stochastic oscillator.
The SuperSmoother is a two-pole low-pass recursion whose coefficients are derived from a chosen cutoff so lag is smaller than that of a comparable moving average.
The roofing filter is the high-pass plus smoother cascade that removes spectral dilation before the stochastic ratio is computed.
The stochastic oscillator is a bounded oscillator that rescales a filtered price series between its recent high and low over a fixed lookback, then optionally smooths that ratio.
SuperSmoother lookback and input
The SuperSmoother is specified as a two-pole recursion whose coefficients use a cutoff of 10 bars, with the current input taken as the average of this close and the prior close.
Platform notes describe the SuperSmoother as a substitute for moving averages intended to reduce aliasing noise while keeping lag smaller than typical smoothing methods.
Roofing filter lookbacks
The roofing stage first applies a high-pass recursion whose alpha is computed from a 48-bar period, then feeds that output into the same 10-bar SuperSmoother.
That two-stage sequence is the trend filter in this construction: it first removes very slow drift and then attenuates high-frequency noise so the remaining series can feed an oscillator.
The roofing filter is presented as the stage that removes spectral dilation before the stochastic ratio is computed.
MESA stochastic ratio
The MESA stochastic is constructed by taking a 20-bar highest-high/lowest-low ratio of the roofed series and then applying the SuperSmoother to that ratio.
The coefficients follow a maximum entropy spectrum design so the filter passband is specified rather than inherited from a simple moving average.
Example oscillator extremes
Example systems treat 0.2 and 0.8 as oscillator extremes.
A long is taken when the MESA stochastic crosses below the oversold threshold at 0.2, and the position is reversed when it exceeds the overbought threshold at 0.8.
Portable reconstructions
Multiple charting platforms published parallel reconstructions of the same three indicators plus an example strategy, confirming the construction is portable across formula languages.
MESA Stochastic on daily Dollar General
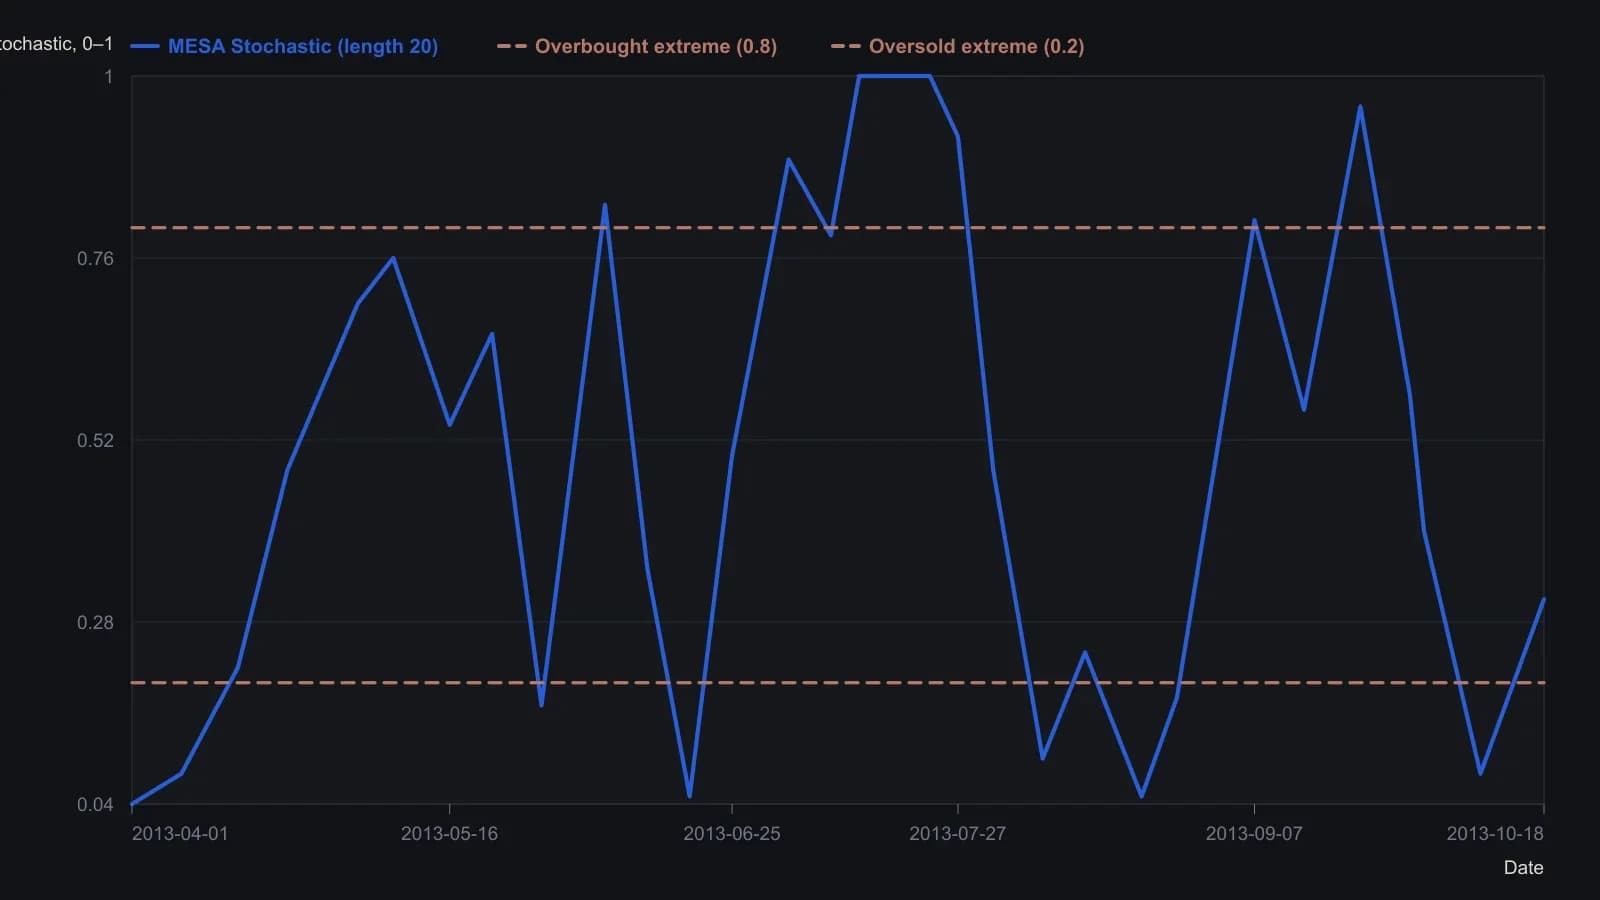
Digitized from the eSignal daily pane titled MesaStochastic_Indicator DG D (20). Y-values are approximate to about two decimals except the labeled last print of 0.31. Horizontal guides at 0.8 and 0.2 are the overbought and oversold extremes named in the Traders’ Tips write-up. The length-20 lookback is the study parameter shown on the chart.
All readings on this track · 28 readings
- 1984Constructing maximum-entropy spectra for dominant-cycle forecasts
- 1984How to construct a maximum-entropy cycle model
- 1984Constructing a maximum-entropy forecast from a chosen lookback
- 1985Constructing period-locked half-cycle and full-cycle averages
- 1986Why Fourier windows limit dominant-cycle resolution
- 1987Assembling short-lookback maximum-entropy cycle forecasts
- 1988Why a fitted dominant cycle is not a forecast
- 1989Evaluating commodity cycle personalities with spectral histograms
- 1989Evaluating next-session cycle forecasts with stops
- 1989Constructing cycle-aged volatility trailing stops
- 1990A channel signal-to-noise gate for dominant-cycle forecasts
- 1990Year-over-year dominant cycle personality audit
- 1991Cyclic entry from a locked dominant-cycle phase
- 1992Stationarity states on synchronized futures spectral contours
- 1997Hidden horizon assumptions in dominant-cycle readings
- 1997When market cycles are absent more than present
- 1997A spectral estimator that retunes indicators to the measured cycle
- 2000Constructing a Hilbert dominant cycle and a maximum-entropy refinement
- 2000Switch trend and cycle indicators after a half-cycle dwell test
- 2000Constructing a dominant-cycle squelch trend filter
- 2000Phasor displays for dominant-cycle construction
- 2002Low-lag trendline from elliptic and dominant-cycle notches
- 2004Spectral peaks are mode diagnostics, not forecasts
- 2004Compressive last-stage oscillator construction
- 2013Constructing trend failure curves from qualified-trend transitions
- 2014Lookback range, a two-lag smoother, and next-bar fills
- 2014Constructing a MESA stochastic with roofing and SuperSmoother filters
- 2016Constructing spectral heatmaps for dominant market cycles