2000issue C051-7
Switch trend and cycle indicators after a half-cycle dwell test
The source models price as a trend mode and a cycle mode and assigns a separate indicator to each mode so the two do not interfere. A trend is declared when price stays on one side of the cycle-stripped residual longer than half the measured dominant-cycle period.
- Assign the residual trendline to trend mode and the sinewave indicator to cycle mode so the two tools do not interfere.
- Form the instantaneous trendline by removing the measured dominant cycle from price. Its lookback follows that period and its lag stays at half the period.
- Declare trend mode only when price remains on one side of the residual longer than half the Hilbert frequency. A later recross ends the trend.
- Use maximum entropy spectrum analysis to obtain the adaptive cycle period that sizes the residual, the dwell test, and the oscillator.
Two modes and two separate indicators
The source models price as a combination of a trend mode and a cycle mode and assigns a separate indicator to each mode so the two do not interfere.
Editorial interpretation: treat those states as mutually exclusive operating states. Use the residual trendline only while a trend is declared, and use the sinewave indicator only while price is in cycle mode. Do not overlay a trend tool and an oscillator at the same time.
How the instantaneous trendline is formed
An instantaneous trendline is formed by measuring the dominant-cycle period and removing that cycle from price, leaving a residual average whose lookback changes with the measured period.
The trendline lag remains half the measured dominant-cycle period. The supplied computation inspects each of the last 40 days.
Maximum entropy spectrum analysis is the method previously introduced to traders for obtaining the adaptive cycle period that drives these indicators. That period is the Hilbert frequency used as the adaptive clock for lag, dwell, and oscillator phase.
The half-cycle dwell test
Cycle mode is defined as price alternating across the residual trendline every half-cycle. Trend mode is defined as price remaining on one side of that residual for longer than half the measured dominant cycle.
A worked chart example declared an uptrend after price stayed above the residual for 7 days, described as half of a 14-day Hilbert frequency, and ended the trend on a subsequent recross.
Instantaneous trendline versus daily price, August 1995–March 1996
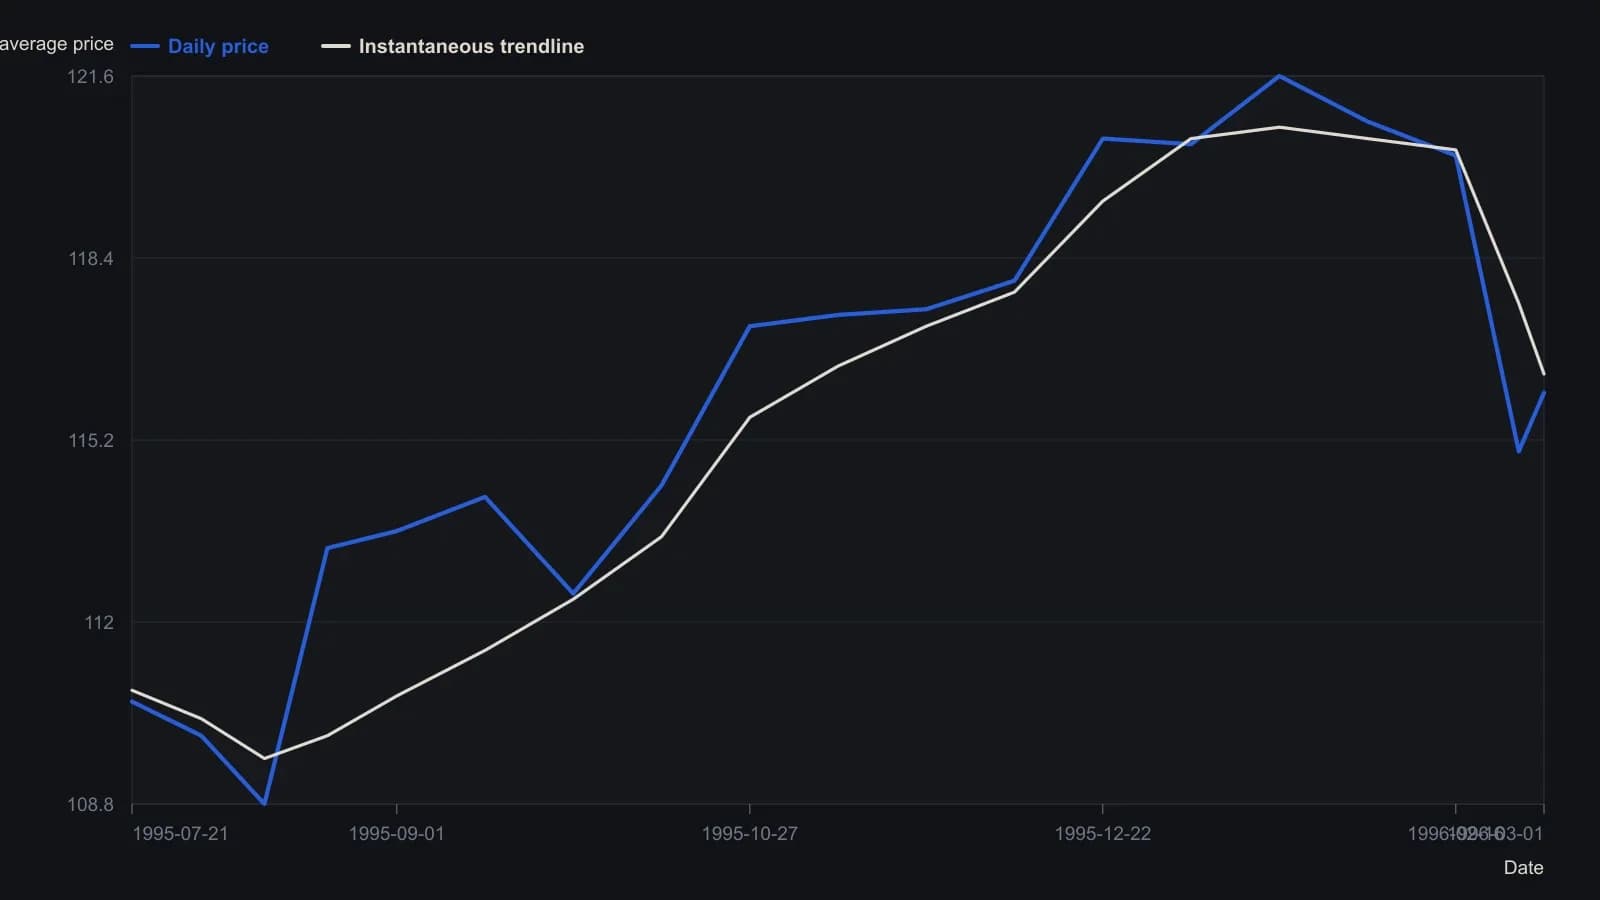
The source does not name the contract. Digitized points are to the nearest 0.1 price unit except the final printed quote. The residual is the dominant-cycle average described in the article, not a fixed-length moving average.
When the sinewave indicator stays quiet
A later adaptive sinewave oscillator is used to seek cycle turning points after the cycle component is isolated. The residual trendline is used only in trend mode.
In the illustrated trend-mode interval the lead-sine line did not cross the sinewave signal, so the oscillator produced no cycle-mode prompts while the trend was declared.
On a second unidentified series the residual stayed above price from late August to mid-December and was treated as the trend interval, with the sinewave used on most of the remaining chart.
All readings on this track · 28 readings
- 1984Constructing maximum-entropy spectra for dominant-cycle forecasts
- 1984How to construct a maximum-entropy cycle model
- 1984Constructing a maximum-entropy forecast from a chosen lookback
- 1985Constructing period-locked half-cycle and full-cycle averages
- 1986Why Fourier windows limit dominant-cycle resolution
- 1987Assembling short-lookback maximum-entropy cycle forecasts
- 1988Why a fitted dominant cycle is not a forecast
- 1989Evaluating commodity cycle personalities with spectral histograms
- 1989Evaluating next-session cycle forecasts with stops
- 1989Constructing cycle-aged volatility trailing stops
- 1990A channel signal-to-noise gate for dominant-cycle forecasts
- 1990Year-over-year dominant cycle personality audit
- 1991Cyclic entry from a locked dominant-cycle phase
- 1992Stationarity states on synchronized futures spectral contours
- 1997Hidden horizon assumptions in dominant-cycle readings
- 1997When market cycles are absent more than present
- 1997A spectral estimator that retunes indicators to the measured cycle
- 2000Constructing a Hilbert dominant cycle and a maximum-entropy refinement
- 2000Switch trend and cycle indicators after a half-cycle dwell test
- 2000Constructing a dominant-cycle squelch trend filter
- 2000Phasor displays for dominant-cycle construction
- 2002Low-lag trendline from elliptic and dominant-cycle notches
- 2004Spectral peaks are mode diagnostics, not forecasts
- 2004Compressive last-stage oscillator construction
- 2013Constructing trend failure curves from qualified-trend transitions
- 2014Lookback range, a two-lag smoother, and next-bar fills
- 2014Constructing a MESA stochastic with roofing and SuperSmoother filters
- 2016Constructing spectral heatmaps for dominant market cycles