1992issue C041-10
Stationarity states on synchronized futures spectral contours
This article teaches a three-state reading of a price-aligned spectral contour so a cycle length is used as a timing reference only while the estimate stays stationary.
- Year-long daily spectral tallies described cyclic structure as present only 15 to 30 percent of the time, with some futures contracts recurring in the same period bands.
- Stacking each day's spectrum as a contour under the matching price bar makes persistence, simultaneous periods, cyclic dropout, and the placement of superimposed cyclic extremes visible in calendar time.
- When period changes abruptly, cycle analysis is invalid for about half a cycle at each transition because the lookback mixes nonstationary data.
- Energy present at all measured periods was treated as noise, and no cycle-based inference was drawn from that stretch.
What a spectral contour shows
Spectral analysis decomposes ordered market observations into cycle-length components whose strength can be tracked from bar to bar. Stacking each day's spectrum as a contour under the matching price bar makes persistence, simultaneous periods, cyclic dropout, and the placement of superimposed cyclic extremes visible in calendar time. That calendar-aligned map of relative period strength is the spectral contour.
A short-record filter bank
Maximum entropy spectrum analysis is treated as a bank of filters spanning periods from eight to 50 days, with component amplitudes compared on a decibel scale relative to the strongest component. The maximum entropy spectrum is a short-record spectral estimate formed by comparing the relative strength of period-tuned filters across a fixed lookback. The dominant cycle is the period that currently holds the largest relative amplitude in the measured band. The filter bank is that set of period-tuned filters spanning the defined range of cycle lengths.
When the estimate is not valid
Stationarity is stability of cycle content across the analysis window. Without it a period estimate is not valid. When period changes abruptly, cycle analysis is invalid for about half a cycle at each transition because the lookback mixes nonstationary data. A short-record entropy estimate is contrasted with a longer-record Fourier transform that market series seldom keep stationary enough to support.
Treasury-bond and equity-index cases
In the December Treasury-bond case, a dominant period near 20 days ended on 28 June 1991 and was replaced by an eight- to 12-day band together with energy longer than 50 days. Editorial note: that handoff is a break in stationarity, after which the contour holds two concurrent ridges rather than one persistent length.
In the December equity-index case, the stronger period wandered between 16 and 30 days, and a late stretch of about 13 days showed energy at all measured periods, which was treated as noise with no cycle-based inference. Editorial note: a wandering dominant period is already a stationarity problem, and the late stretch is broadband noise.
Metals, meats, currencies, and grains
Gold, live cattle, and live hogs were shown with little stable structure below 50 days, the two meat contracts dominated by broadband spectral fill. Editorial note: those meat contours stay in the broadband-noise state, so no short-band dominant cycle is treated as a timing reference.
Two currency contracts did not share the same August structure: one showed a brief 15-day ridge, the other a fairly consistent 12-day ridge under a trend. Cocoa concentrated near 12 to 14 days from April through July and then roughly doubled after the trend turned up, while wheat showed a relatively strong 12-day component over the last four months of an uptrend. Editorial note: cycle personality is contract-specific, and cocoa's later doubling is a period change that leaves the earlier length invalid across the transition.
December 1991 cocoa: 12–14 day cycle, then a doubled noisy length
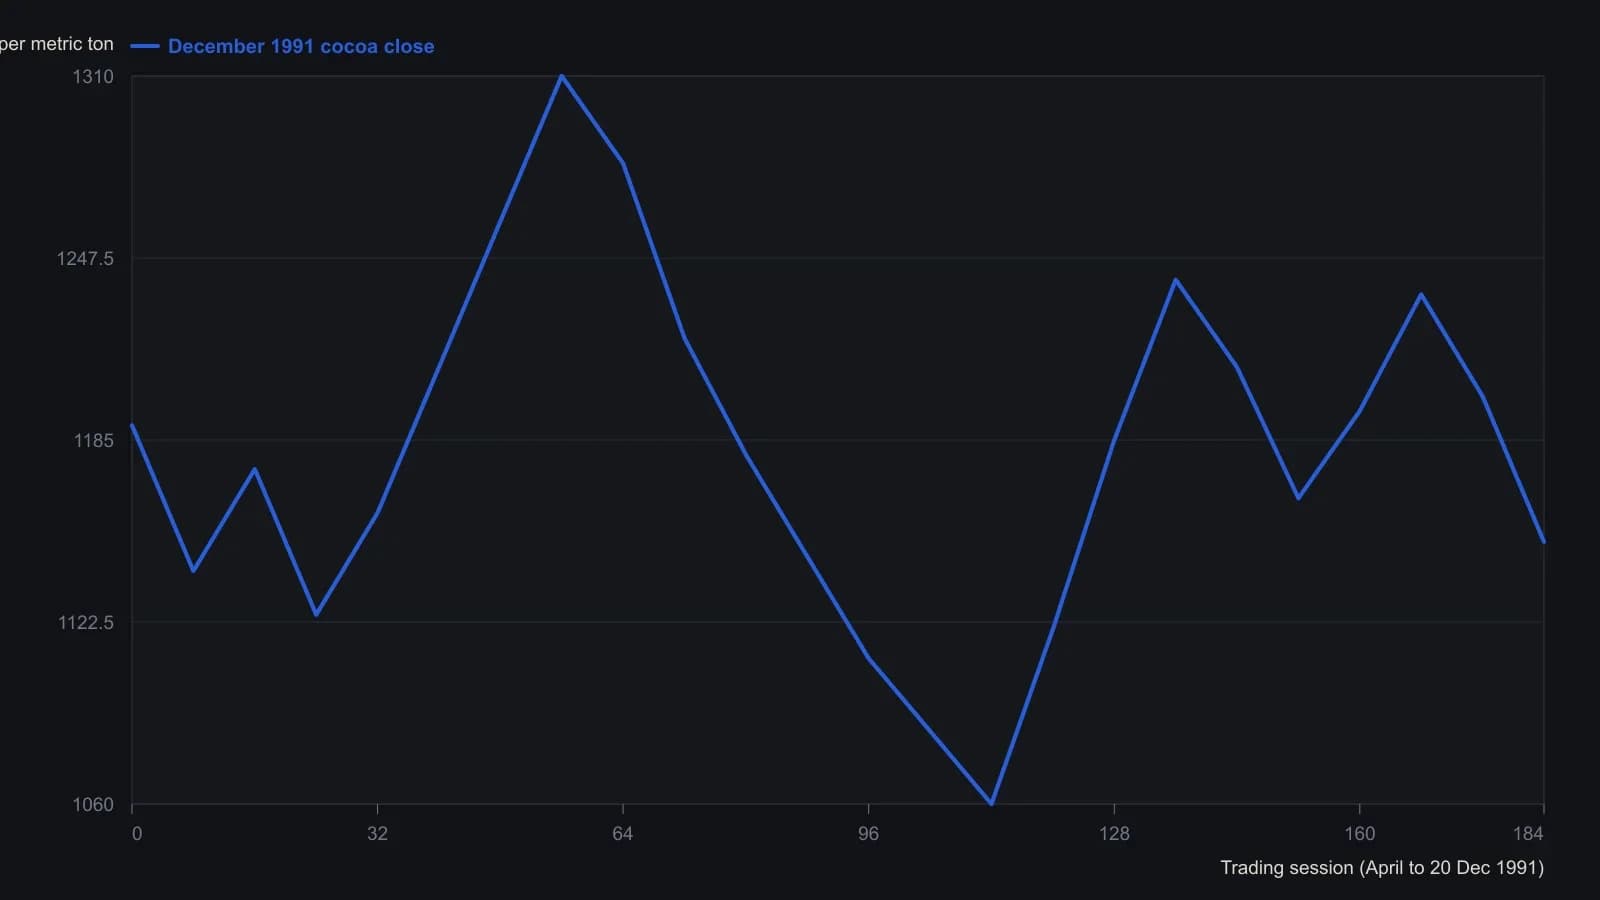
MESA filter bank 8–50 days; December cocoa through the 20 Dec 1991 quote. Cycle lengths are the source annotations, not a second digitized series. Prices are approximate readings from a coarse raster (~20-point grid); do not treat them as ticks.
How often the structure appears
Year-long daily spectral tallies described cyclic structure as present only 15 to 30 percent of the time, with some futures contracts recurring in the same period bands. Cycle personality is a contract's tendency, when cyclic at all, to concentrate energy in a recurring period band.
All readings on this track · 28 readings
- 1984Constructing maximum-entropy spectra for dominant-cycle forecasts
- 1984How to construct a maximum-entropy cycle model
- 1984Constructing a maximum-entropy forecast from a chosen lookback
- 1985Constructing period-locked half-cycle and full-cycle averages
- 1986Why Fourier windows limit dominant-cycle resolution
- 1987Assembling short-lookback maximum-entropy cycle forecasts
- 1988Why a fitted dominant cycle is not a forecast
- 1989Evaluating commodity cycle personalities with spectral histograms
- 1989Evaluating next-session cycle forecasts with stops
- 1989Constructing cycle-aged volatility trailing stops
- 1990A channel signal-to-noise gate for dominant-cycle forecasts
- 1990Year-over-year dominant cycle personality audit
- 1991Cyclic entry from a locked dominant-cycle phase
- 1992Stationarity states on synchronized futures spectral contours
- 1997Hidden horizon assumptions in dominant-cycle readings
- 1997When market cycles are absent more than present
- 1997A spectral estimator that retunes indicators to the measured cycle
- 2000Constructing a Hilbert dominant cycle and a maximum-entropy refinement
- 2000Switch trend and cycle indicators after a half-cycle dwell test
- 2000Constructing a dominant-cycle squelch trend filter
- 2000Phasor displays for dominant-cycle construction
- 2002Low-lag trendline from elliptic and dominant-cycle notches
- 2004Spectral peaks are mode diagnostics, not forecasts
- 2004Compressive last-stage oscillator construction
- 2013Constructing trend failure curves from qualified-trend transitions
- 2014Lookback range, a two-lag smoother, and next-bar fills
- 2014Constructing a MESA stochastic with roofing and SuperSmoother filters
- 2016Constructing spectral heatmaps for dominant market cycles