1989issue C051-5
Evaluating next-session cycle forecasts with stops
A spectral next-session call can be scored twice: first on whether the projected slope matches the cash close-to-close move, then on whether the same call, after a low-content skip and an opening stop, still describes the futures open-to-close path.
- Next-session direction came from the slope of a short projected path, not from a half-cycle hold at a peak or trough.
- Cash close-to-close direction and futures open-to-close results were scored as separate tests because a correct index call did not always match the futures session.
- Low spectrum content and poor-resolution warnings withheld a directional call, and a stop-loss booked an opening-to-adverse-extreme limit instead of the close.
- Adding costs and the stop changed counted wins when a small correct session move failed to cover costs or an early stop differed from holding to the close.
Two tests for one spectral call
The evaluated design read next-session direction from a maximum-entropy spectrum of the latest observations and a short projected continuation of that path. The recovered cycle, or set of cycles, was treated as the dominant cycle for the next interval, so the slope of the projected path could be read as a long or short mark for the following session only.
Editorial reading: treat that mark as two tests, not one. First ask whether the projected slope matches the cash close-to-close move. Then ask whether the same call, after a low-content skip and an opening stop, still describes the futures open-to-close path.
How the next-session mark was formed
A maximum-entropy spectrum is a short-lookback spectrum of ordered observations used to recover cycles in a window and project a brief continuation path. After a synthetic check, the slope of that projected curve was treated as the next-session long or short signal rather than as a half-cycle hold from a peak or trough.
The working sample was a rolling lookback updated each evening. The next session was marked long, short, or later as no-trade. Next-session direction meant entry at the open and exit at the close unless a skip or stop intervened.
A synthetic check before market data
Before market data were used, the same spectrum was checked on a compound synthetic series built from out-of-phase sine waves with drifting periods and amplitudes. Only after that check was the slope of the projected path read as next-session direction.
Cash close-to-close versus futures open-to-close
Close-to-close cash-index direction was scored separately from open-to-close futures results. A correct index call did not always match the futures session. That mismatch is index-futures slippage: a correct cash close-to-close call fails to stay in synch with the futures open-to-close move because of premium shifts or opening gaps.
A skip filter and an opening stop
Low spectrum content and poor-resolution warnings were used as a cycle-content filter. Those days were not given a next-session direction.
A stop-loss column compared the opening-to-adverse extreme with a limit. On a hit, that limit was booked as the day's result instead of the close. The stop-loss here is a pre-set opening-to-adverse-extreme limit that ends a same-session position at a fixed loss instead of holding to the close.
Why counted wins changed
Adding costs and the stop changed counted wins. A small correct session move might fail to cover costs, and an early stop could differ from holding to the close. Editorial reading: the cash-direction test and the futures path after skip, stop, and costs answer different questions about the same spectral call.
Next-session MESA slope hits after the content skip
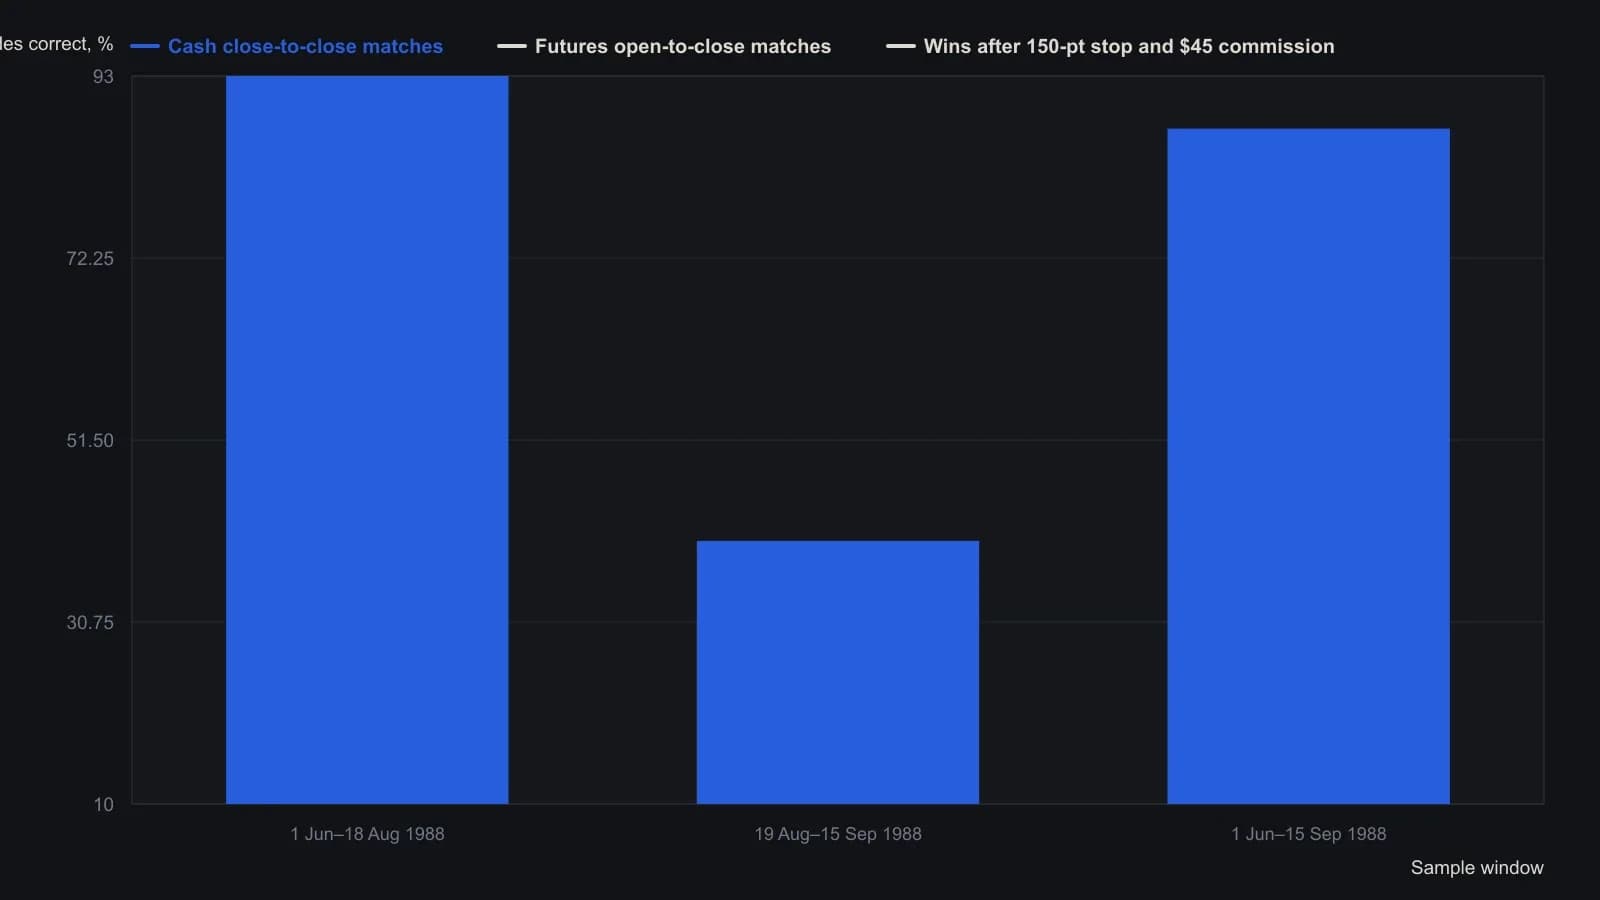
MESA was run on the last 60 S&P 500 cash closes. Sessions flagged for low spectral content or poor resolution were skipped. The stop column uses a 150-point limit from the futures open and a $45 commission.
All readings on this track · 28 readings
- 1984Constructing maximum-entropy spectra for dominant-cycle forecasts
- 1984How to construct a maximum-entropy cycle model
- 1984Constructing a maximum-entropy forecast from a chosen lookback
- 1985Constructing period-locked half-cycle and full-cycle averages
- 1986Why Fourier windows limit dominant-cycle resolution
- 1987Assembling short-lookback maximum-entropy cycle forecasts
- 1988Why a fitted dominant cycle is not a forecast
- 1989Evaluating commodity cycle personalities with spectral histograms
- 1989Evaluating next-session cycle forecasts with stops
- 1989Constructing cycle-aged volatility trailing stops
- 1990A channel signal-to-noise gate for dominant-cycle forecasts
- 1990Year-over-year dominant cycle personality audit
- 1991Cyclic entry from a locked dominant-cycle phase
- 1992Stationarity states on synchronized futures spectral contours
- 1997Hidden horizon assumptions in dominant-cycle readings
- 1997When market cycles are absent more than present
- 1997A spectral estimator that retunes indicators to the measured cycle
- 2000Constructing a Hilbert dominant cycle and a maximum-entropy refinement
- 2000Switch trend and cycle indicators after a half-cycle dwell test
- 2000Constructing a dominant-cycle squelch trend filter
- 2000Phasor displays for dominant-cycle construction
- 2002Low-lag trendline from elliptic and dominant-cycle notches
- 2004Spectral peaks are mode diagnostics, not forecasts
- 2004Compressive last-stage oscillator construction
- 2013Constructing trend failure curves from qualified-trend transitions
- 2014Lookback range, a two-lag smoother, and next-bar fills
- 2014Constructing a MESA stochastic with roofing and SuperSmoother filters
- 2016Constructing spectral heatmaps for dominant market cycles