1987issue C101-11
Assembling short-lookback maximum-entropy cycle forecasts
A short-horizon cycle construction starts with a one-to-two-cycle lookback, accepts a maximum-entropy spectrum only when one dominant cycle stands clear of competing peaks, and recombines the resolved components as a timing sketch. A weak, crowded, or trend-dominated spectrum is treated as a reason to withhold the forecast.
- Keep the lookback between one and two dominant-cycle lengths so older bars do not describe a random path that has already changed.
- Accept the maximum-entropy spectrum only when a single dominant cycle is well resolved and cycle content sits above the usefulness threshold.
- Recombine resolved cycles in phase and amplitude as a timing sketch, and refresh it until a crossing of price and the half-dominant-cycle average is imminent.
- If cycle content is weak, several peaks are near equal, the dominant peak is poorly resolved, or a long-period tail signals trend dominance, ignore the forecast.
What the construction assembles
Maximum entropy spectrum analysis isolates coherent cycles from a short ordered price series. It is presented as avoiding the windowing and end-effect distortions associated with Fourier analysis.
A working construction pairs three displays: a bar history with a half-dominant-cycle average scaled by π/2 from the trendline, a relative-amplitude spectrum, and a forward path formed by recombining resolved cycles in phase and amplitude.
Choose a one-to-two-cycle lookback
Short-term cycles are framed as transient solutions of a random-walk process in which momentum, not direction, is the random variable, so they can appear, change, and fade quickly.
The dominant cycle is the strongest resolved periodicity in the spectrum. It sets the moving-average length, the minimum usable lookback, and the main term in a synthesized forecast.
Valid analysis requires at least one full dominant-cycle length of data. Using more than two dominant-cycle lengths is discouraged because older observations may no longer describe the current random path.
Accept only a clear dominant cycle
Spectral analysis compares relative cycle amplitudes, often on a logarithmic decibel scale, to judge resolution, the noise floor, and whether a forecast construction is valid. Cycle content is the decibel measure of how far the dominant cycle sits above a stated usefulness threshold. Use that reading to decide whether recombination is warranted.
Accept the spectrum only when a single dominant cycle stands clear of competing peaks. In one illustrated equity example, 37 post-trend observations resolved a 21-day dominant cycle and a 9-day secondary cycle about 10 dB weaker, with cycle content 6 dB above a zero usefulness threshold.
A deterministic sawtooth built from a 15-day fundamental plus a half-amplitude 7.5-day harmonic and a one-third-amplitude 5-day harmonic was resolved into those three components from only 30 days of data and then resynthesized into a close match of the original waveform.
MESA spectrum for Delta Airlines, 30 Aug 1981
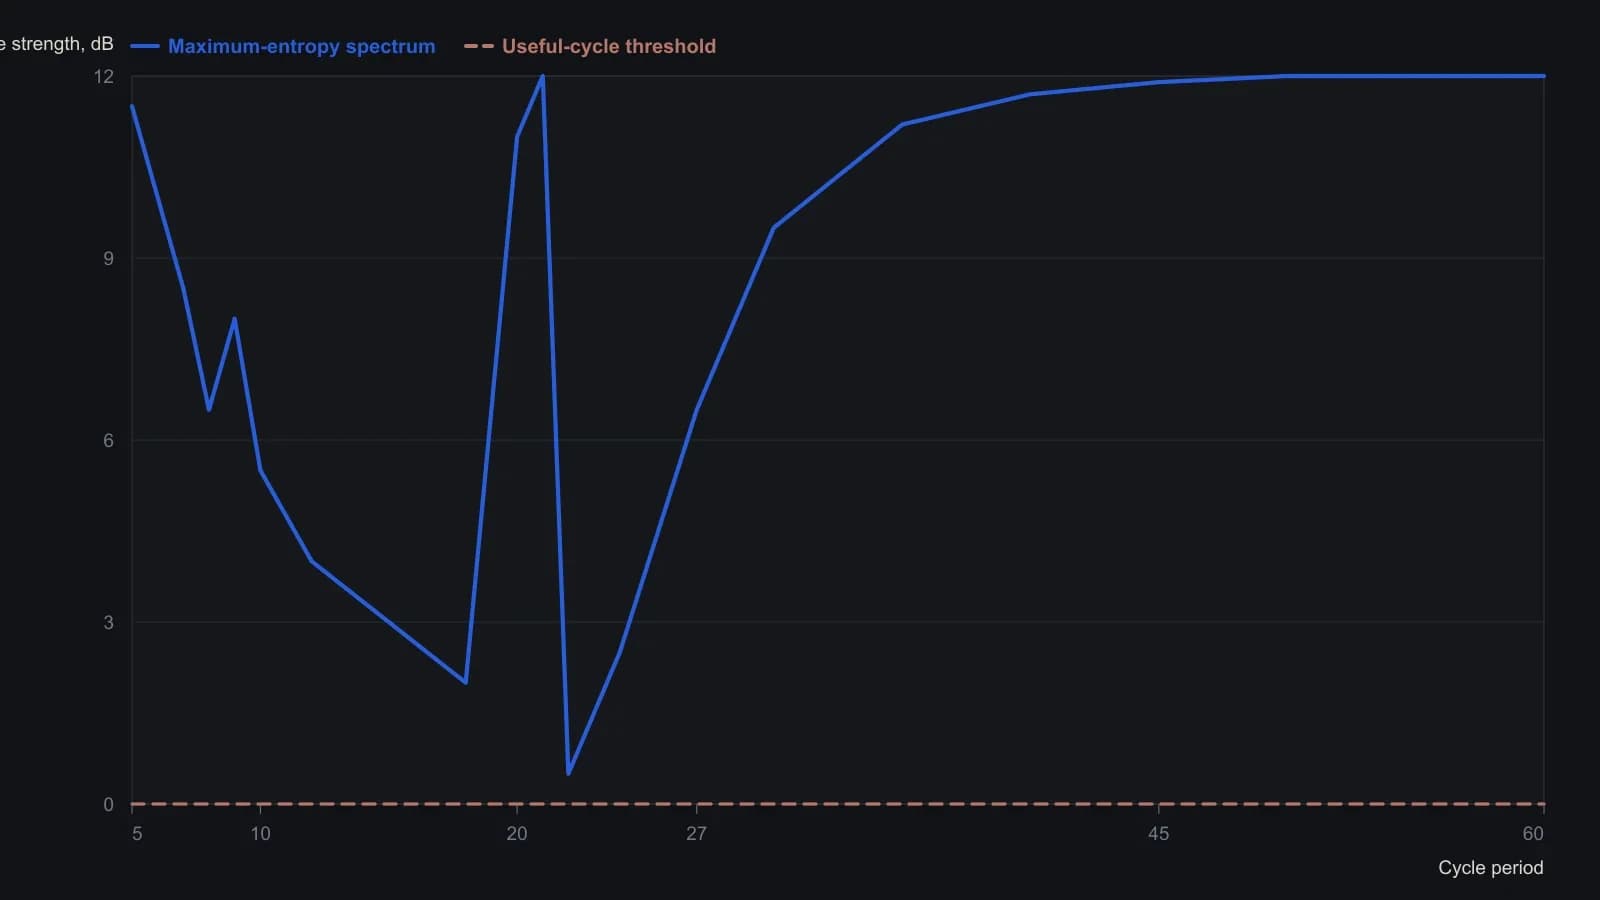
Thirty-seven trading days after the prior downtrend were used so the window covers just under two 21-day cycles. Vertical scale is relative strength in decibels; digitizing a CRT raster is approximate.
Recombine as a timing sketch
On the history chart, the half-dominant-cycle average is a smoother whose length is half the dominant cycle and whose deviation from the trendline is scaled by π/2. It is used as a crossing reference.
The forward path is formed by recombining the resolved cycles in phase and amplitude. That path is treated as a timing sketch rather than a level forecast. It can be refreshed daily until a crossing of price and the half-dominant-cycle average is imminent, or a warning says cycle analysis is not appropriate.
The same checklist on other bars
The same spectral construction can be run on weekly, daily, or intradaily bars. One reported set of dominant periods scaled as 44, 22, and 11 bars on 15-minute, 30-minute, and hourly charts respectively.
Short-term cycles suitable for this construction were estimated to be present only about 20% of the time, and the implementation issues warnings when cycle analysis is not appropriate.
All readings on this track · 28 readings
- 1984Constructing maximum-entropy spectra for dominant-cycle forecasts
- 1984How to construct a maximum-entropy cycle model
- 1984Constructing a maximum-entropy forecast from a chosen lookback
- 1985Constructing period-locked half-cycle and full-cycle averages
- 1986Why Fourier windows limit dominant-cycle resolution
- 1987Assembling short-lookback maximum-entropy cycle forecasts
- 1988Why a fitted dominant cycle is not a forecast
- 1989Evaluating commodity cycle personalities with spectral histograms
- 1989Evaluating next-session cycle forecasts with stops
- 1989Constructing cycle-aged volatility trailing stops
- 1990A channel signal-to-noise gate for dominant-cycle forecasts
- 1990Year-over-year dominant cycle personality audit
- 1991Cyclic entry from a locked dominant-cycle phase
- 1992Stationarity states on synchronized futures spectral contours
- 1997Hidden horizon assumptions in dominant-cycle readings
- 1997When market cycles are absent more than present
- 1997A spectral estimator that retunes indicators to the measured cycle
- 2000Constructing a Hilbert dominant cycle and a maximum-entropy refinement
- 2000Switch trend and cycle indicators after a half-cycle dwell test
- 2000Constructing a dominant-cycle squelch trend filter
- 2000Phasor displays for dominant-cycle construction
- 2002Low-lag trendline from elliptic and dominant-cycle notches
- 2004Spectral peaks are mode diagnostics, not forecasts
- 2004Compressive last-stage oscillator construction
- 2013Constructing trend failure curves from qualified-trend transitions
- 2014Lookback range, a two-lag smoother, and next-bar fills
- 2014Constructing a MESA stochastic with roofing and SuperSmoother filters
- 2016Constructing spectral heatmaps for dominant market cycles