1984issue C061-16
Constructing a maximum-entropy forecast from a chosen lookback
A maximum-entropy-spectrum construction estimates how many forecast coefficients to keep, and how large they are, from a user-chosen window of ordered prices, volume, or breadth. The result is an autoregressive path with widening probability-limits, so data-length, filter degree, and order selection stay visible as the model.
- Coefficient count and size are estimated from the chosen data-length alone, and that window is treated as the whole process being extrapolated.
- A moving-average filter and a resample step precede the autoregressive predictor, so sampling interval and order are explicit construction choices.
- A lookback that mixes a long decline with a long rise is treated as if both regimes remain equally likely, and the probability-limits then widen quickly.
- Automatic mode reports a final-prediction-error array so a minimum-error order, a near-tie, or a need for more data can be inspected.
The window is the process
The construction accepts a user-chosen historical length and estimates both how many forecast coefficients to use and their sizes from that window alone. The data-length is treated as the whole process the construction will extrapolate.
The same spectrum routine can be applied to open, high, low, close, volume, open interest, or derived series such as RSI or TRIX. The implementation asks for a data-length between 4 and 230 observations. The worked daily-close example used 21 weeks.
Filter, resample, and order
The method is an ARMA-style forecast. A moving-average filter and a D-point resample precede an M-order autoregressive predictor, and band width follows Box-Jenkins forecast-error formulas.
Differencing is offered as a one-step momentum transform but is not the default, because it overweights short cycles and removes long cycles and major trends. The default construction leaves the series undifferenced.
How automatic mode exposes the choice
Automatic mode searches sampling interval and maximum order, then reports a final-prediction-error array so a minimum-error order, a near-tie, or a need for more data can be inspected.
The overlay and the bands
The forecast overlay starts at the latest date minus the sampling length used to average the history. The user chooses 95 percent or 99.5 percent confidence bands as the probability-limits around the projected path.
When daily closes are the input, the plotted bands are drawn to cover the full high-to-low range rather than close-only error. A lookback that mixes a long decline with a long rise is treated as if both regimes remain equally likely, and the probability-limits then widen quickly.
A synthetic check of the spectrum
On a synthetic series of trend plus two sinusoids plus low-level noise, the optimizer selected D of 4 and M of 6. The log spectrum showed a low-frequency trend peak plus the two sinusoidal peaks after noise was suppressed.
MEM log spectrum of the synthetic test series (D=4, M=6)
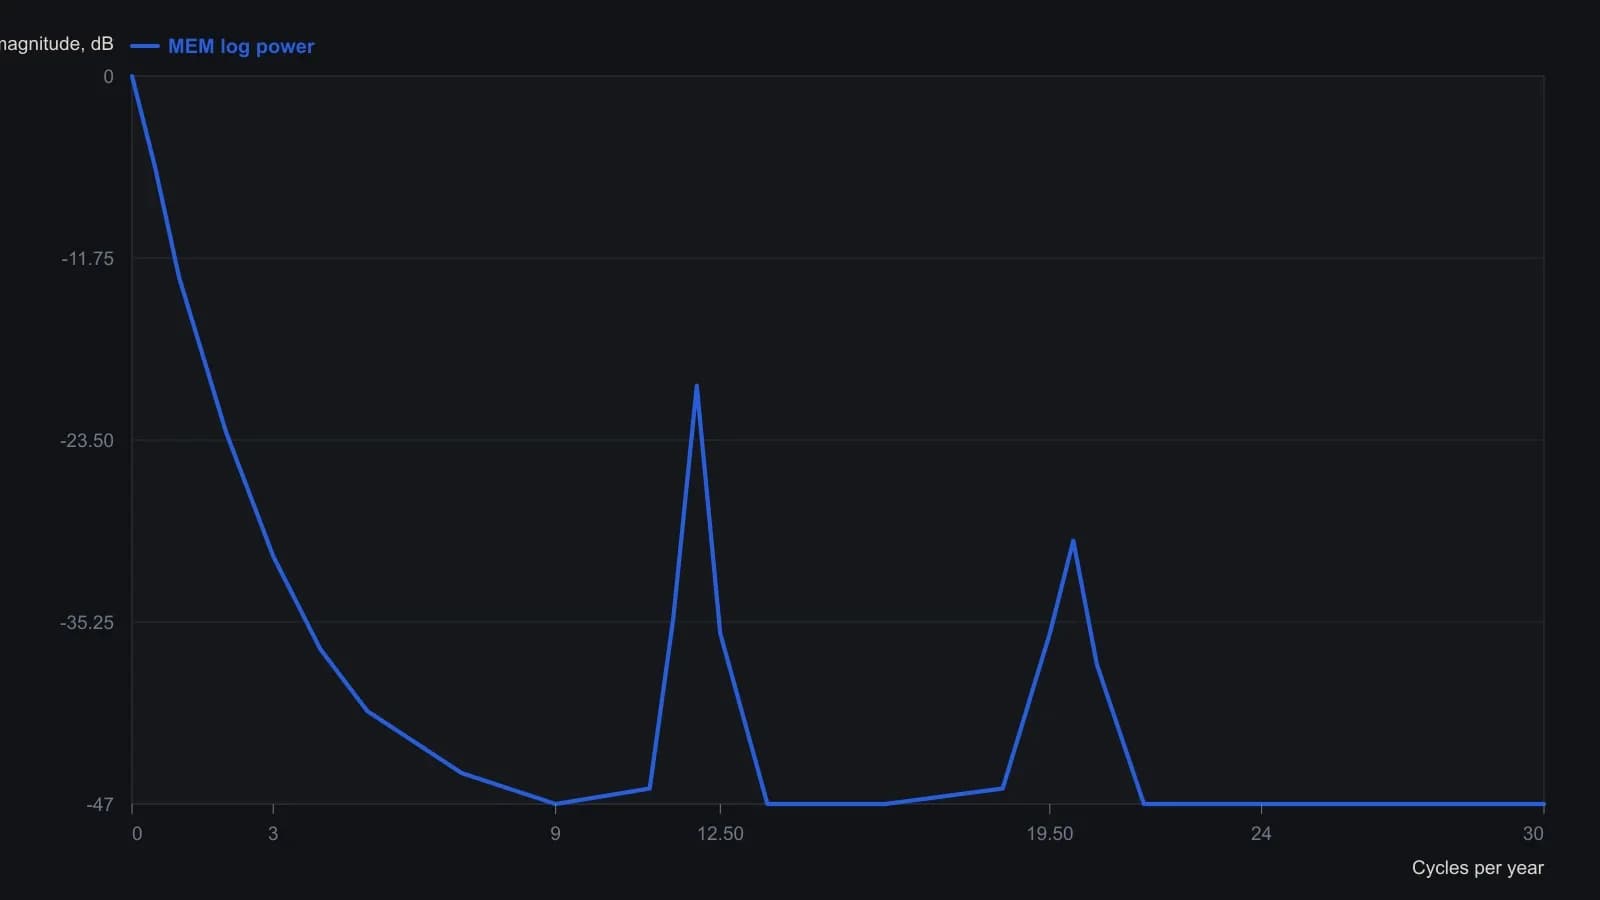
FPE minimization on the synthetic series (linear trend, two sinusoids, light Gaussian noise) chose resample interval D=4 and MEM order M=6. The frequency axis is compressed by D, so the plot ends near 31 cycles per year at 250 samples per year. Magnitudes are approximate; the scan does not support decibel tenths.
All readings on this track · 28 readings
- 1984Constructing maximum-entropy spectra for dominant-cycle forecasts
- 1984How to construct a maximum-entropy cycle model
- 1984Constructing a maximum-entropy forecast from a chosen lookback
- 1985Constructing period-locked half-cycle and full-cycle averages
- 1986Why Fourier windows limit dominant-cycle resolution
- 1987Assembling short-lookback maximum-entropy cycle forecasts
- 1988Why a fitted dominant cycle is not a forecast
- 1989Evaluating commodity cycle personalities with spectral histograms
- 1989Evaluating next-session cycle forecasts with stops
- 1989Constructing cycle-aged volatility trailing stops
- 1990A channel signal-to-noise gate for dominant-cycle forecasts
- 1990Year-over-year dominant cycle personality audit
- 1991Cyclic entry from a locked dominant-cycle phase
- 1992Stationarity states on synchronized futures spectral contours
- 1997Hidden horizon assumptions in dominant-cycle readings
- 1997When market cycles are absent more than present
- 1997A spectral estimator that retunes indicators to the measured cycle
- 2000Constructing a Hilbert dominant cycle and a maximum-entropy refinement
- 2000Switch trend and cycle indicators after a half-cycle dwell test
- 2000Constructing a dominant-cycle squelch trend filter
- 2000Phasor displays for dominant-cycle construction
- 2002Low-lag trendline from elliptic and dominant-cycle notches
- 2004Spectral peaks are mode diagnostics, not forecasts
- 2004Compressive last-stage oscillator construction
- 2013Constructing trend failure curves from qualified-trend transitions
- 2014Lookback range, a two-lag smoother, and next-bar fills
- 2014Constructing a MESA stochastic with roofing and SuperSmoother filters
- 2016Constructing spectral heatmaps for dominant market cycles